Loading market briefing…
49 tools. Four at a time.
The inflation calculator, portfolio analysis, SEC filings, the options scanner, and forty-five more, rotating so the page stays in motion.
Inflation calculator
See what a dollar from any year since 1913 is really worth today, and what today's dollar would have been worth then. Full history, free and public, no account needed, so purchasing power is one click away.
Open the calculatorPortfolio analysis
Value every holding together: day profit and loss, income, and the full book in one panel.
SEC filings
Company 10-K and 10-Q passages pulled beside the quote, on the questions that matter.
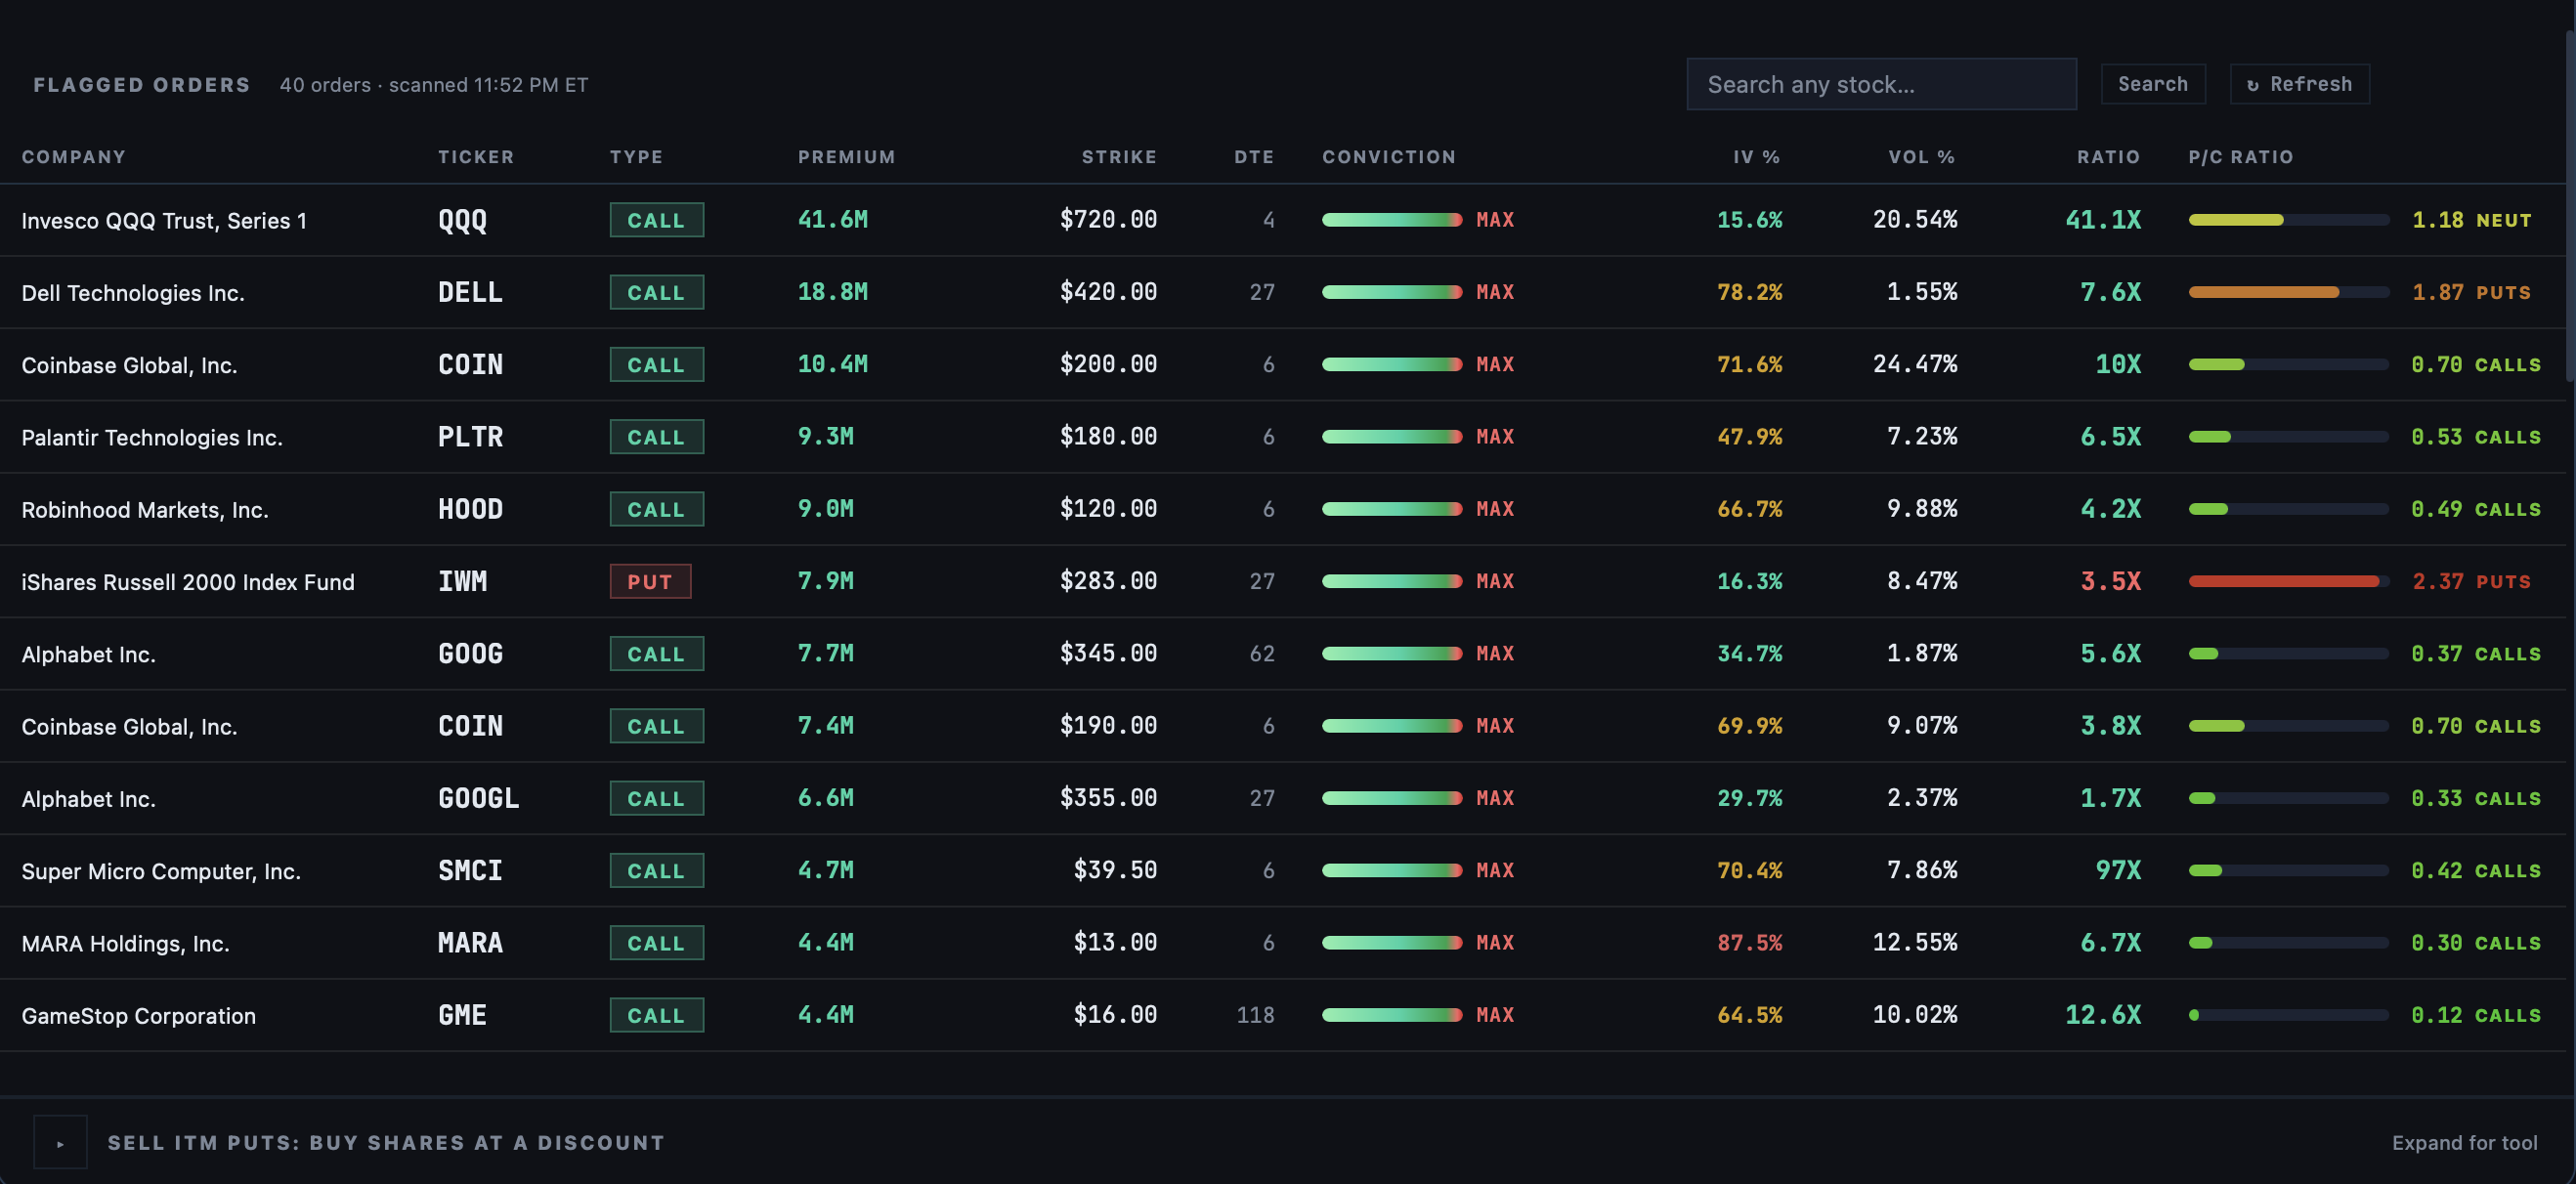
Options scanner
Unusual options activity across the tape, ranked so the interesting contracts rise first.
Research Deep Dive
A sourced company note with a verified competitor table and an income statement grade.
EFM factor model
Ten weighted factors scored across the S&P 500, refreshed in the morning session.
Q business quality
A 0 to 100 reading of how the business itself is built: margins, cash, growth, and balance sheet.
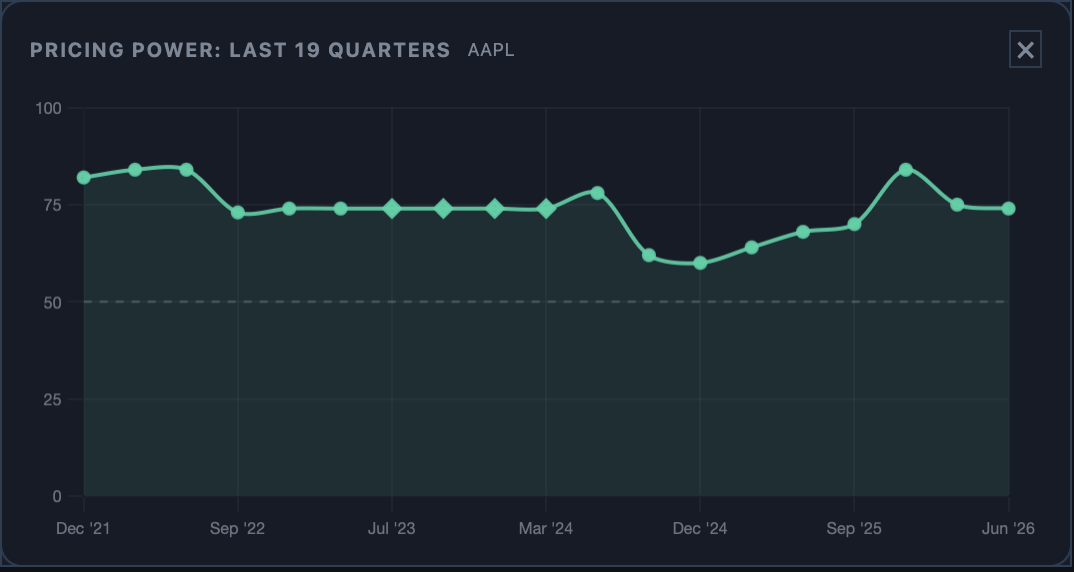
Pricing Power
Peer-relative margin defense, scored from filings, 0 to 100.
Gold futures
A structured COMEX gold report: market overview, setups, and execution notes.

Next Session
A name is listed only once two independent signals already agree, a confirmed earnings window, extended-hours tape, or volume well above its own average. No forecast, no invented direction, an empty board is a valid answer too.
Treasury yields
The curve as published, with the forwards already priced into it.
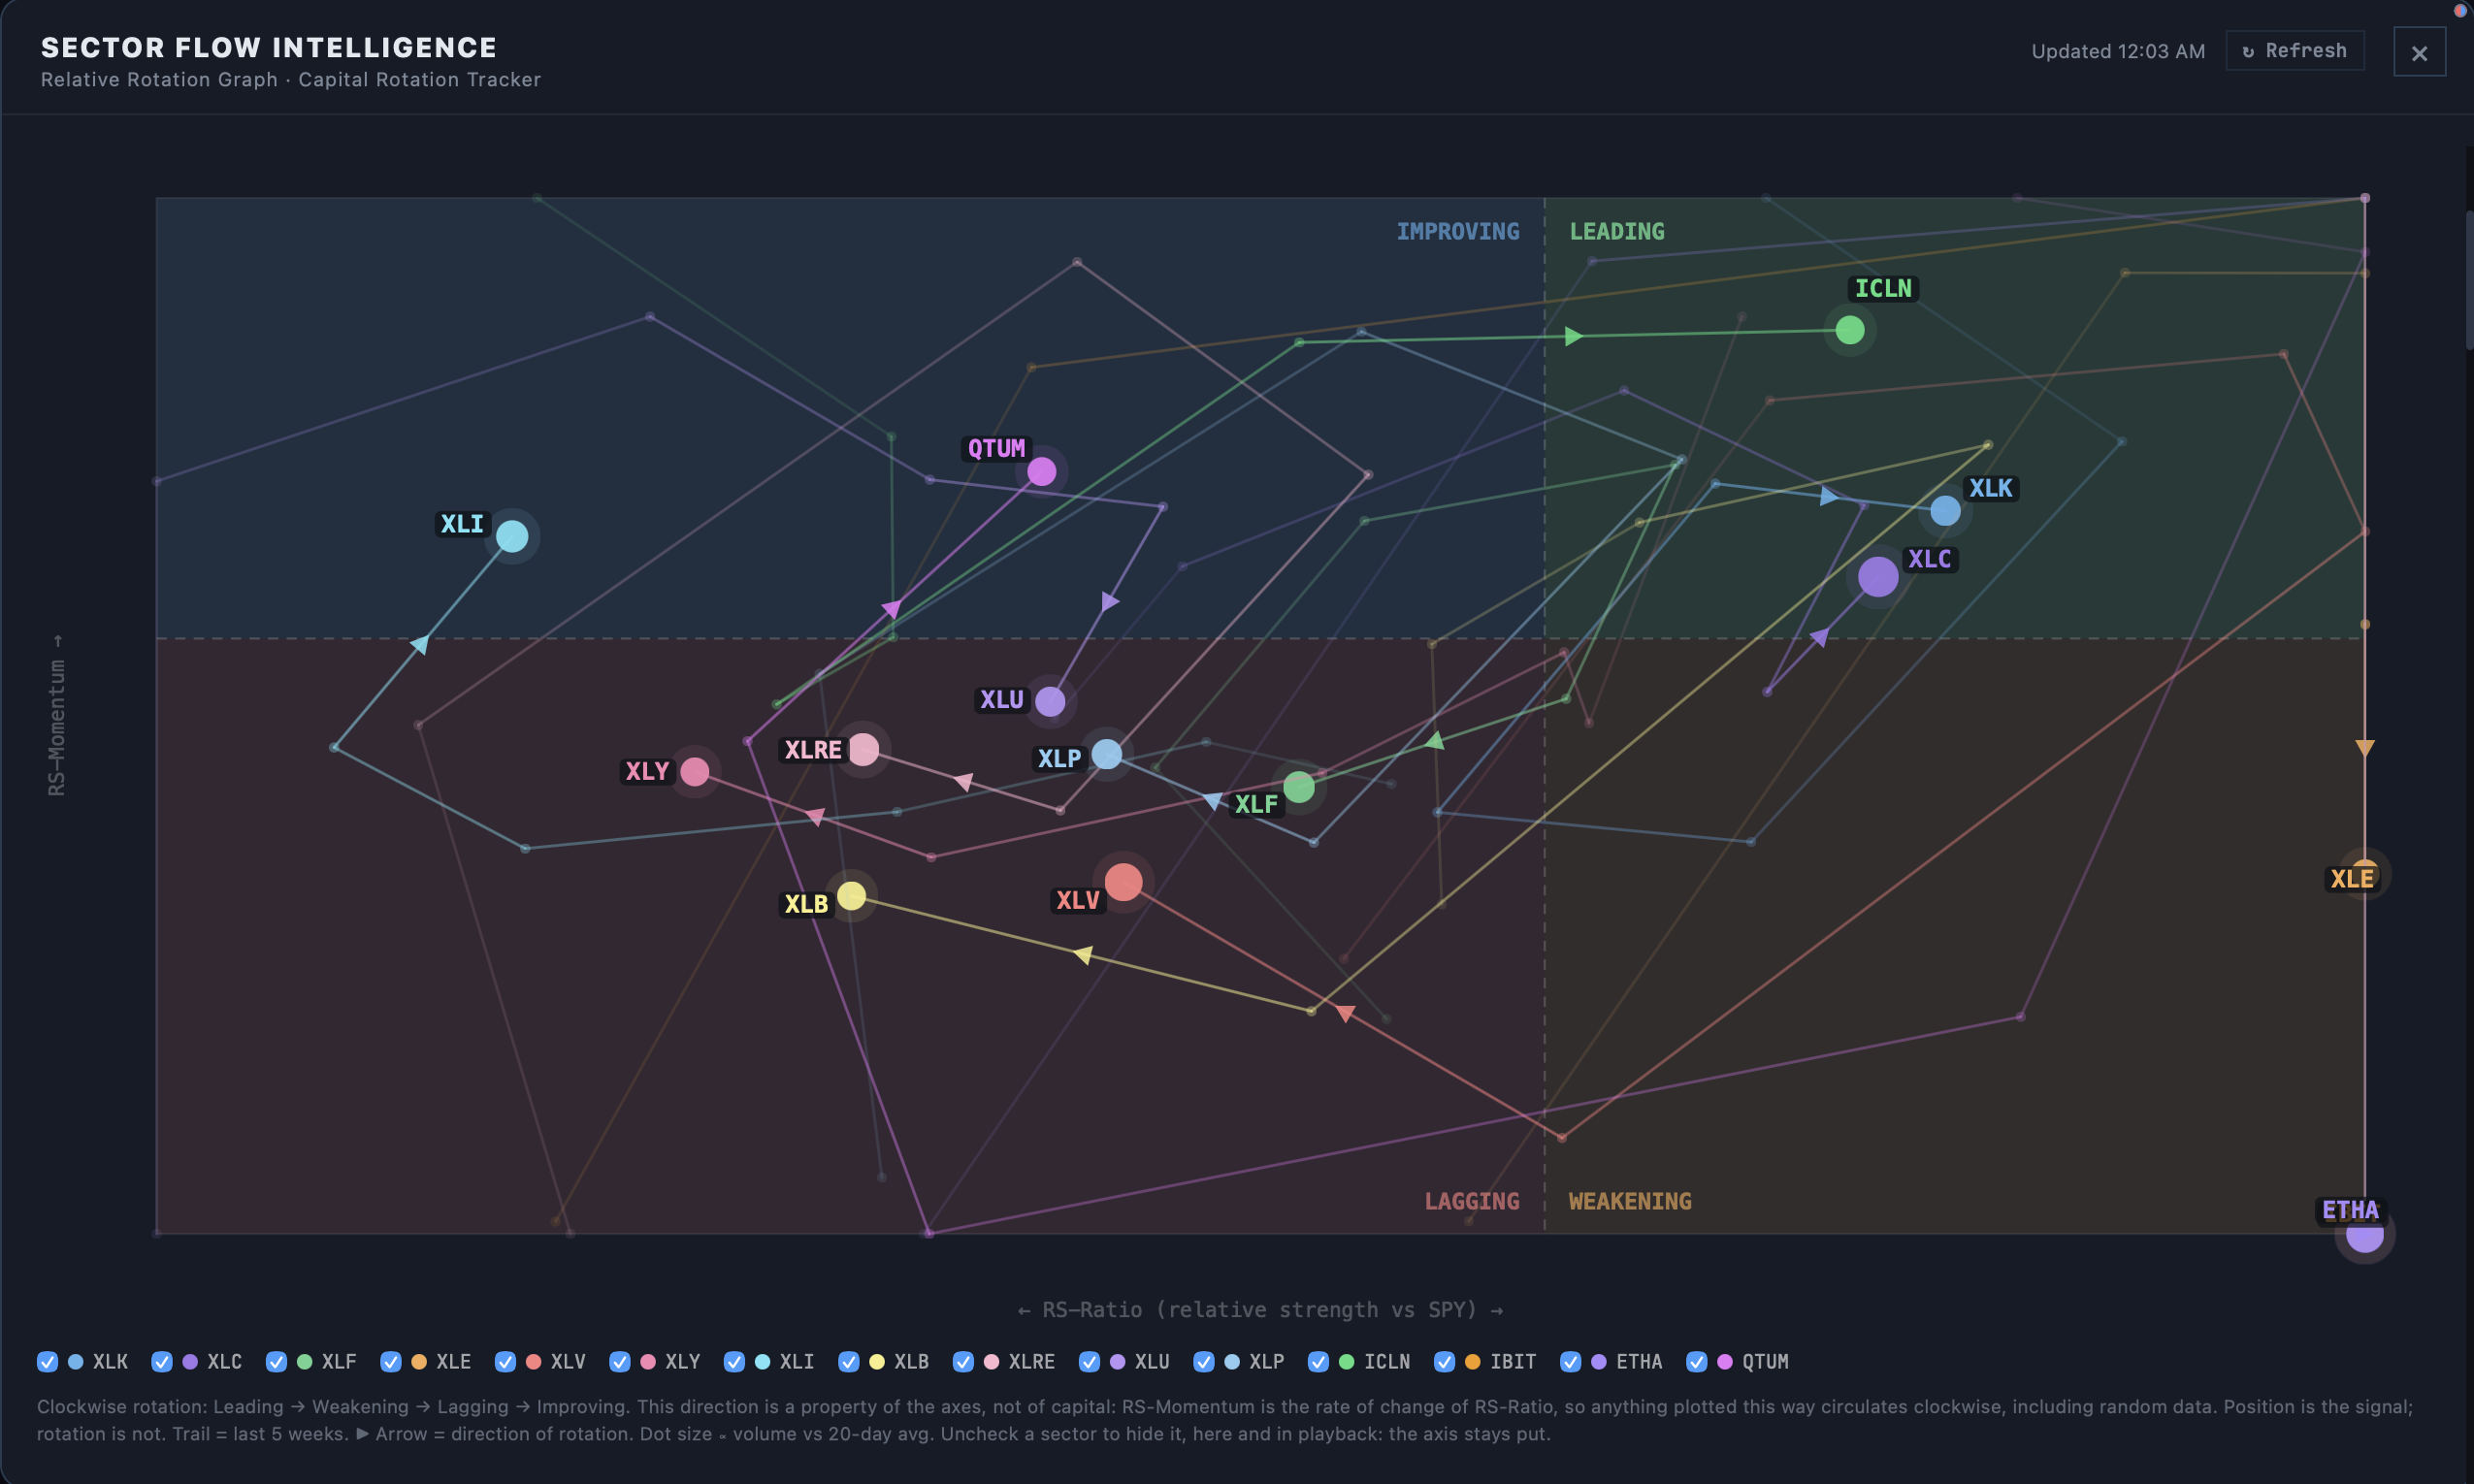
Sector Flow
Rotation, fund flows, heatmaps, and the companies inside each sector fund.
Share lots
Purchases, sales, and realized profit and loss on the same record.
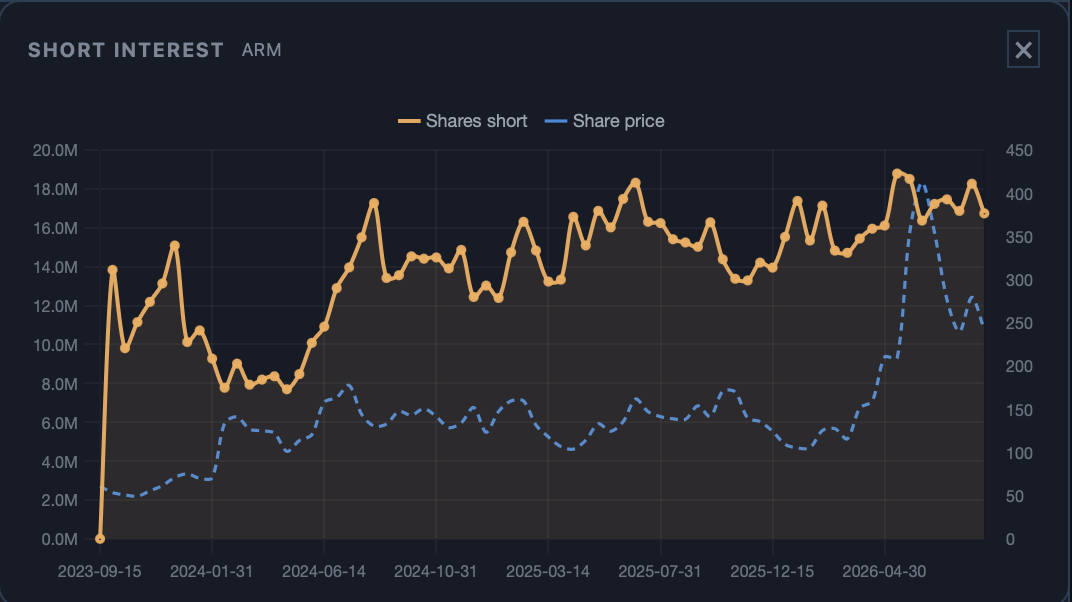
Short interest
Five years of shares short drawn against the share price.
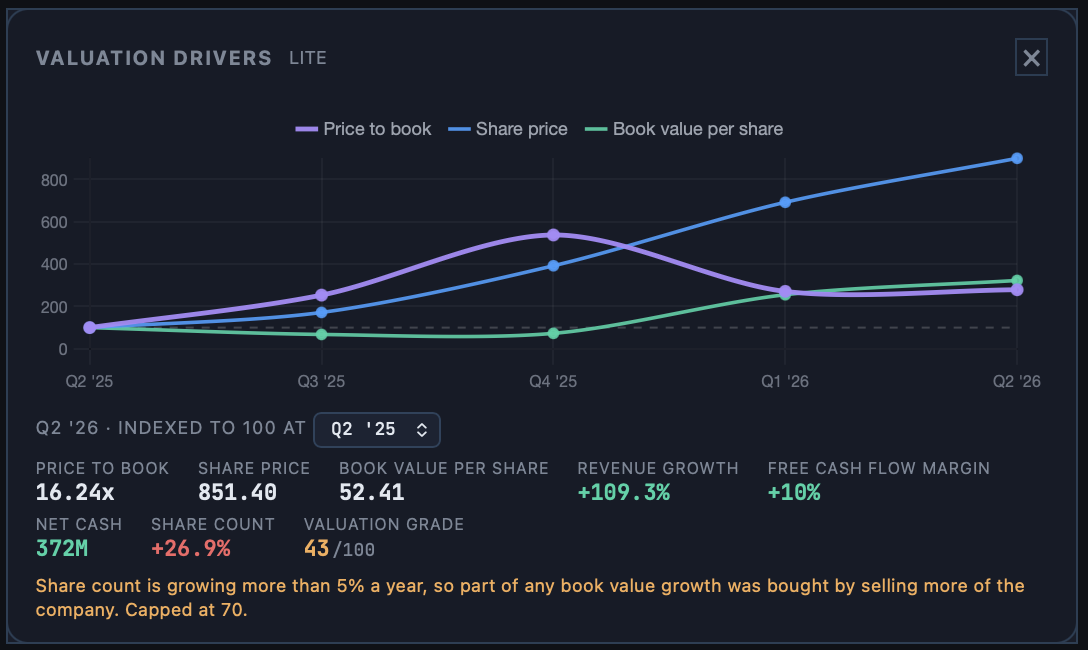
Valuation Drivers
Share price, book value per share, and the ratio, indexed together from a named quarter.
Insider trades
Filed buys and sells on the same card as the fundamentals.
Analyst consensus
Covering firms and the ratings they published, in their own words.
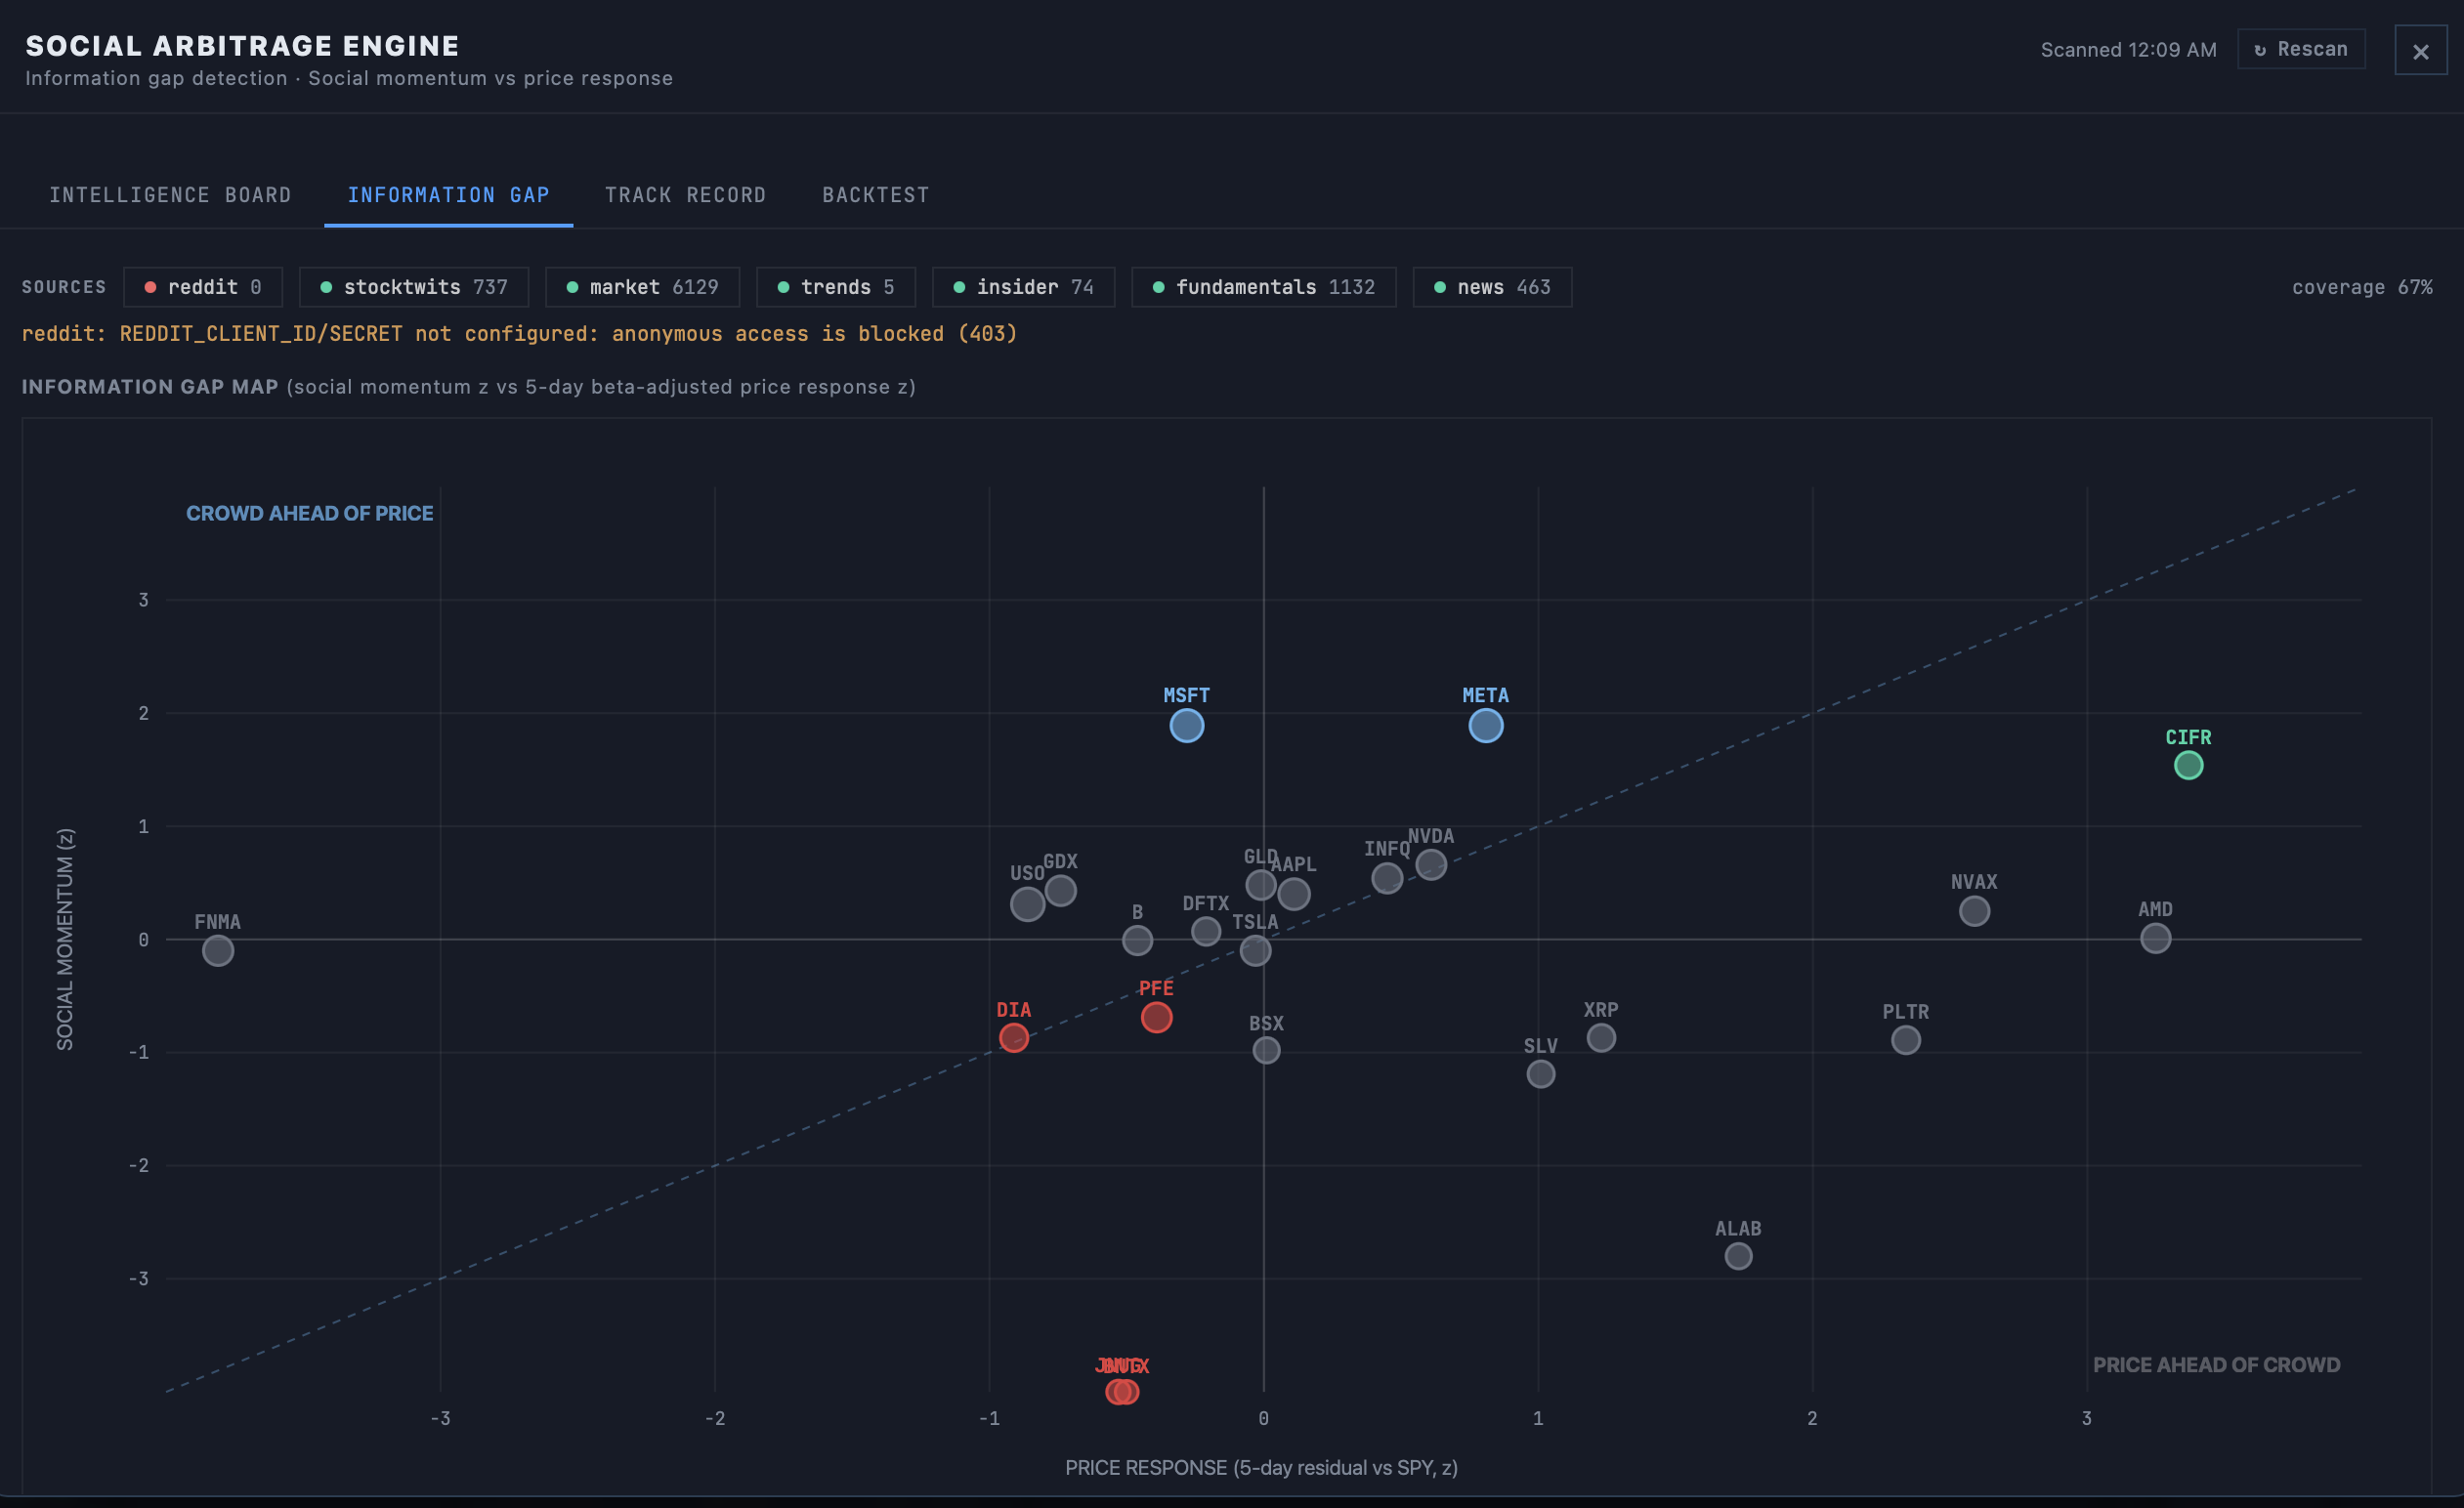
Social Arbitrage
Ranked narrative and social flow across names, with a track record beside the score.
Earnings results
Results pinned on the news card and marked on the price chart the session they land.
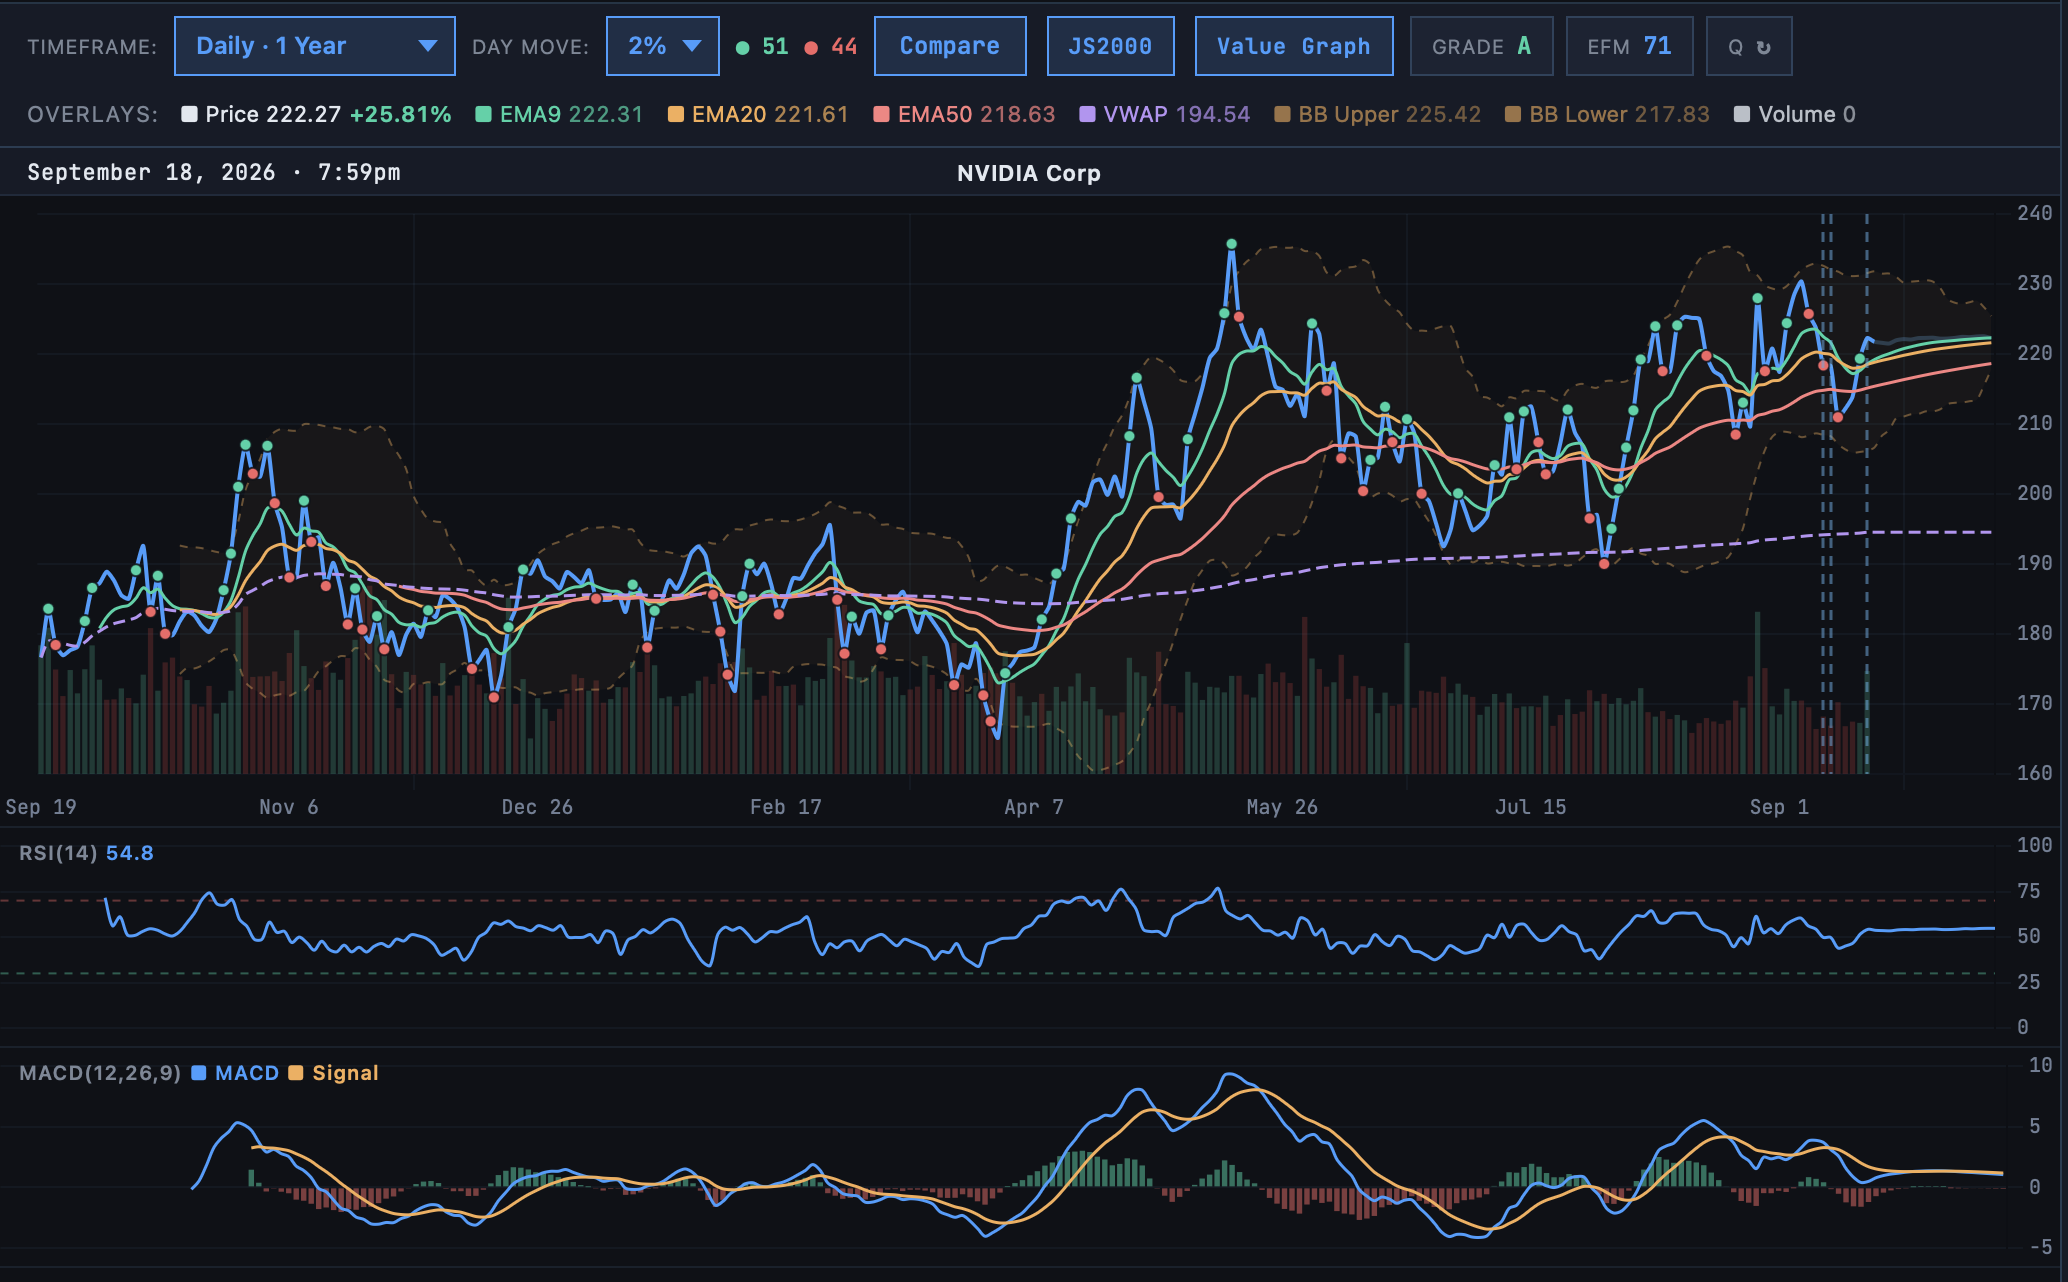
The price chart
Moving averages, VWAP, and Bollinger Bands over price, RSI and MACD below it, and a grade, an EFM score, and a Q score sitting right in the toolbar.

QuantOne
Four lenses on one board, Deep Scan, Factor Scan, Timing, and a blended Composite reading, run against custom tickers, the S&P 100, or a portfolio's own holdings.
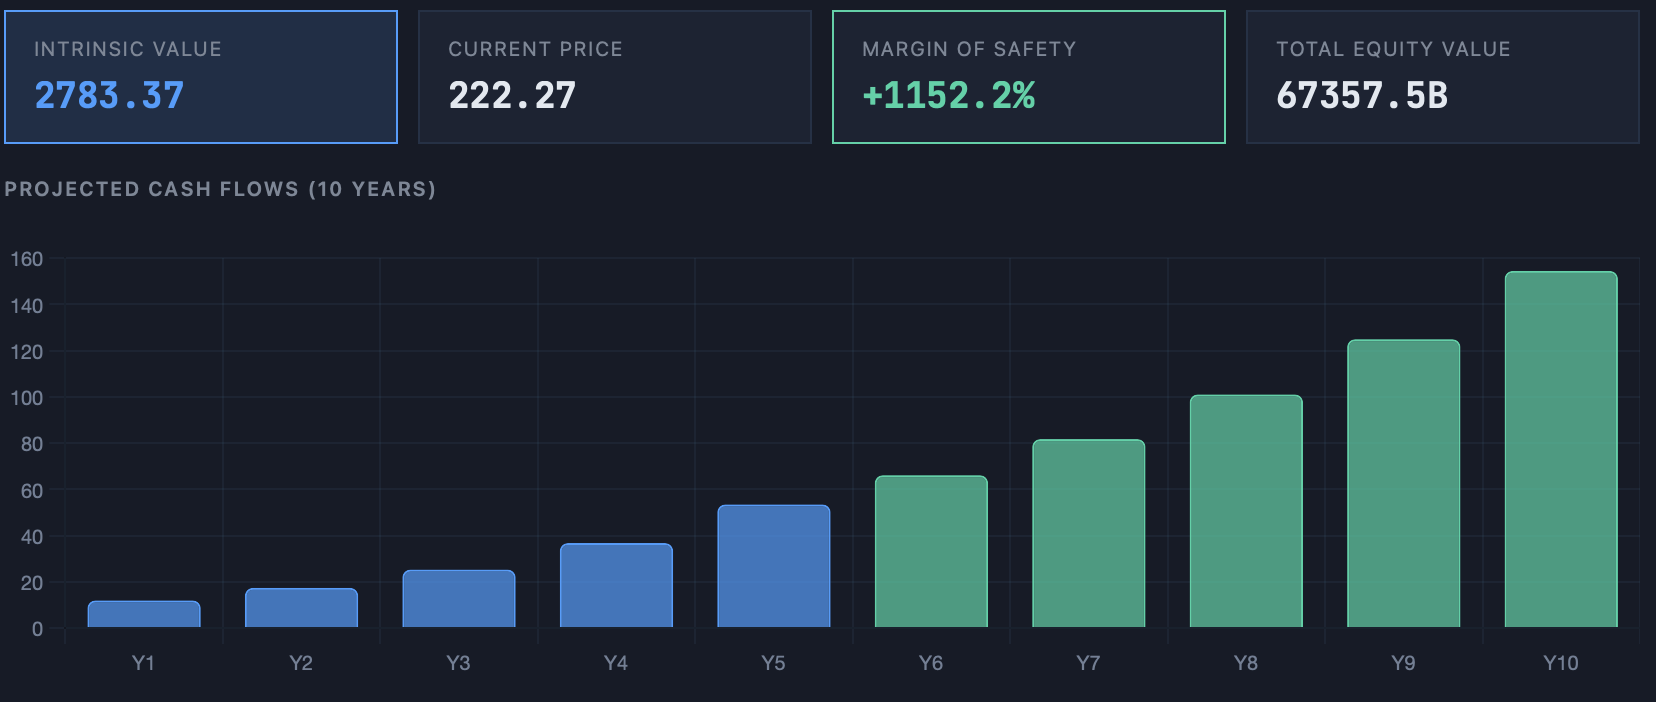
DCF model
Ten years of projected cash flows set beside today's price, so the assumptions behind an intrinsic value estimate are visible, not just the number.
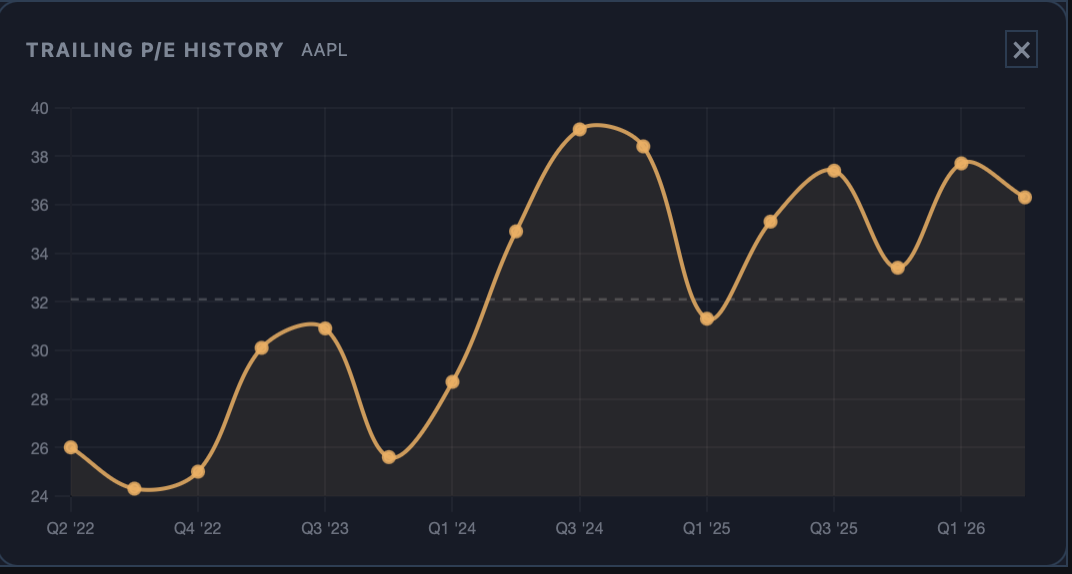
Trailing P/E
How today's multiple sits against its own history, not just a single snapshot beside the ticker.
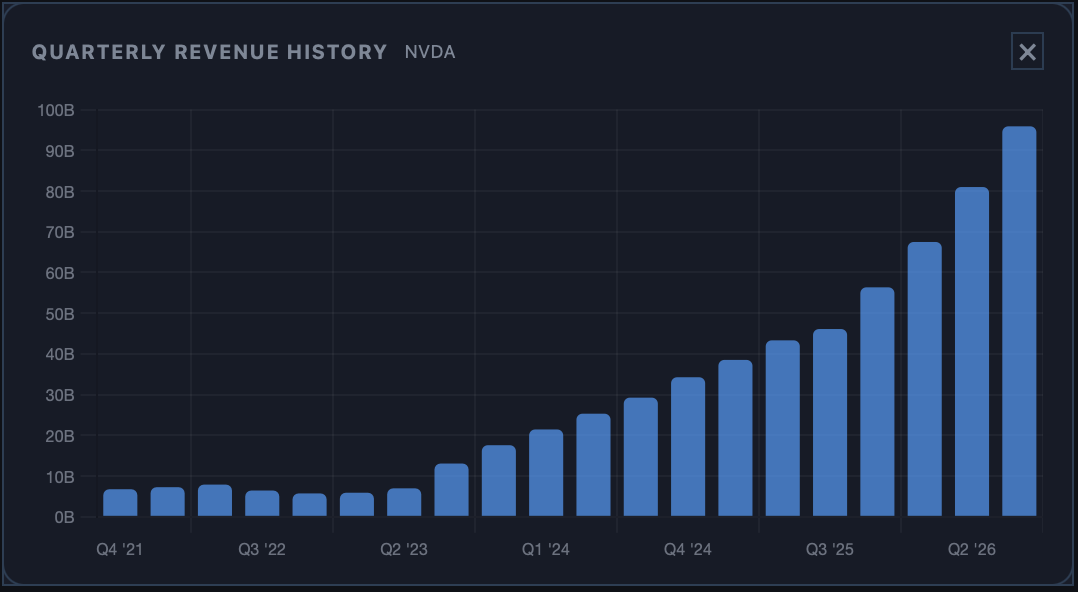
Revenue history
Quarterly revenue going back several years on one bar chart, so a strong quarter reads in context instead of alone.
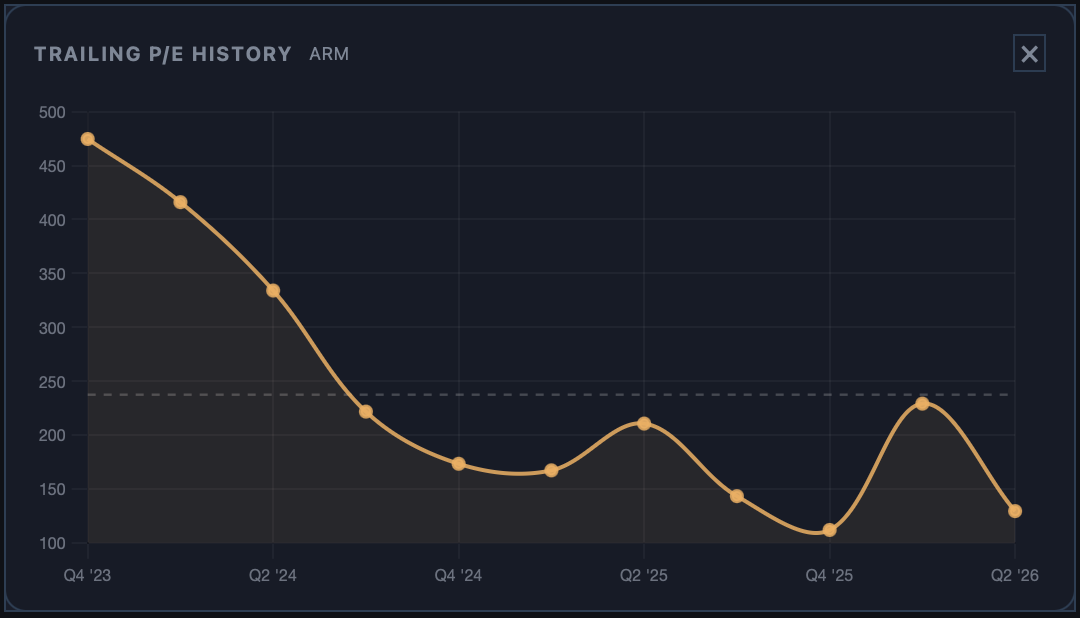
Trailing P/E
The same history on a name where it moved fast: a multiple near five hundred compressing to a fraction of that as earnings caught up.
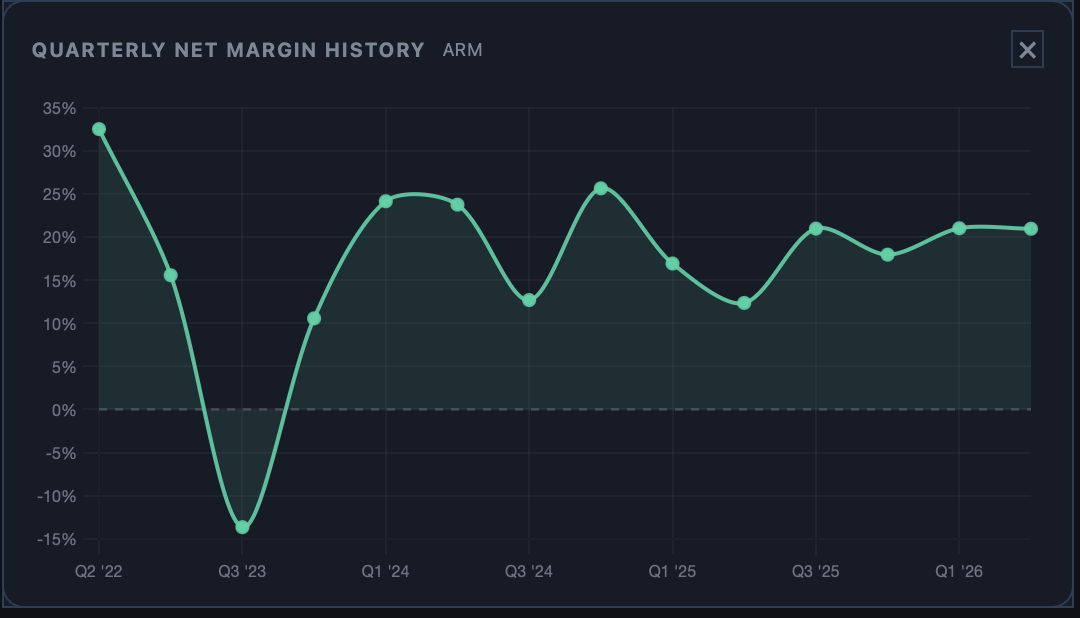
Net margin
Quarterly net margin charted over time, so a turnaround, or a slide, shows up as a trend instead of one quarter's number.
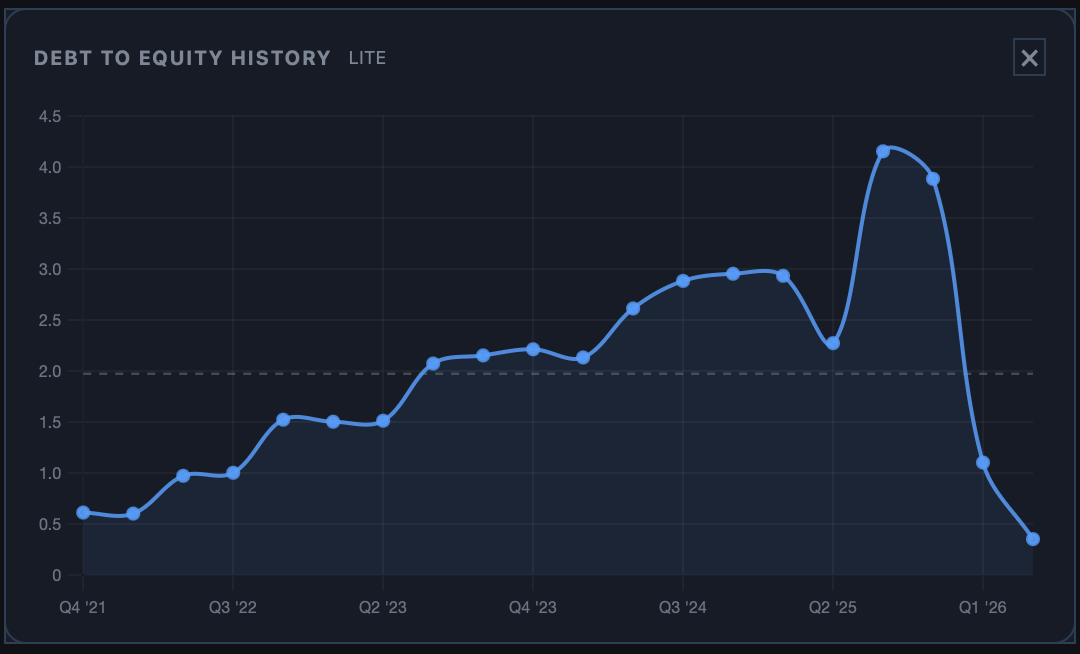
Debt to Equity
Leverage over time, not a single ratio on one day. The trend matters as much as the level.
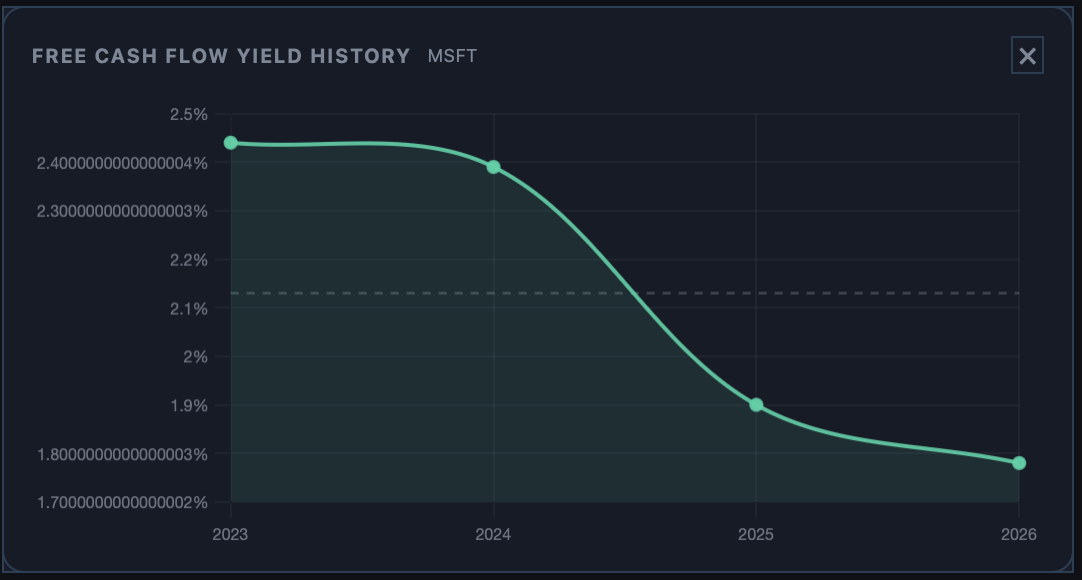
FCF Yield
Free cash flow yield charted across time instead of left as a single number for the quarter.
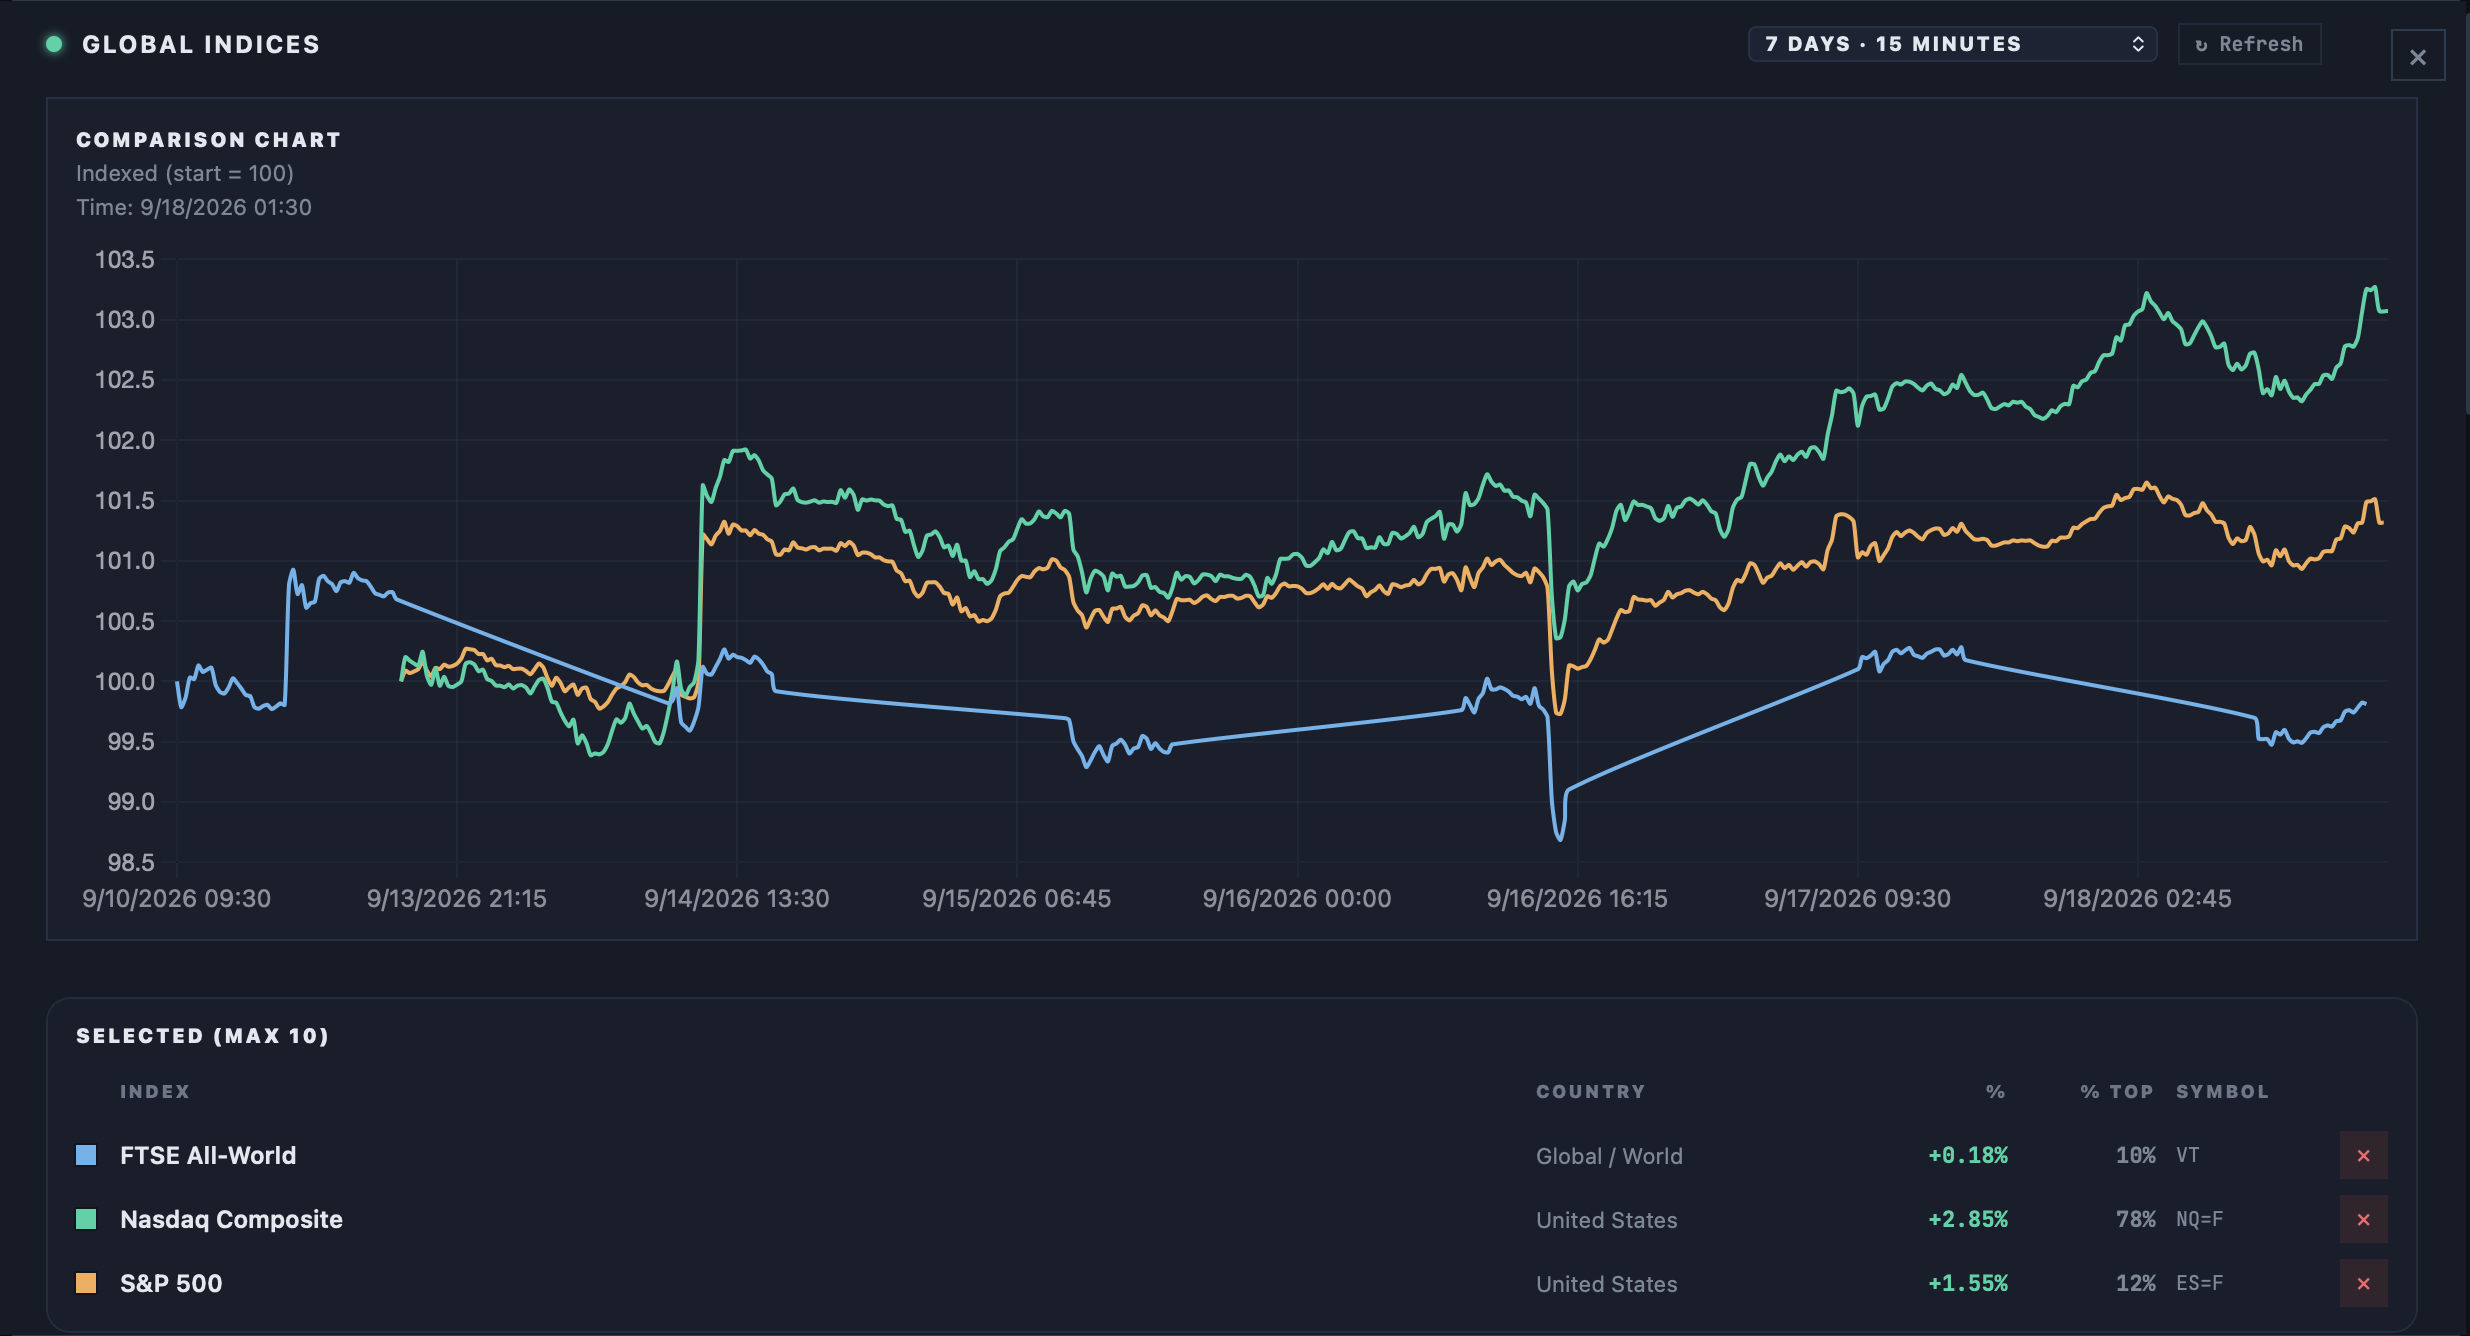
Global Indices
Major world benchmarks on one indexed comparison chart, so a session's relative winners and laggards read at a glance.
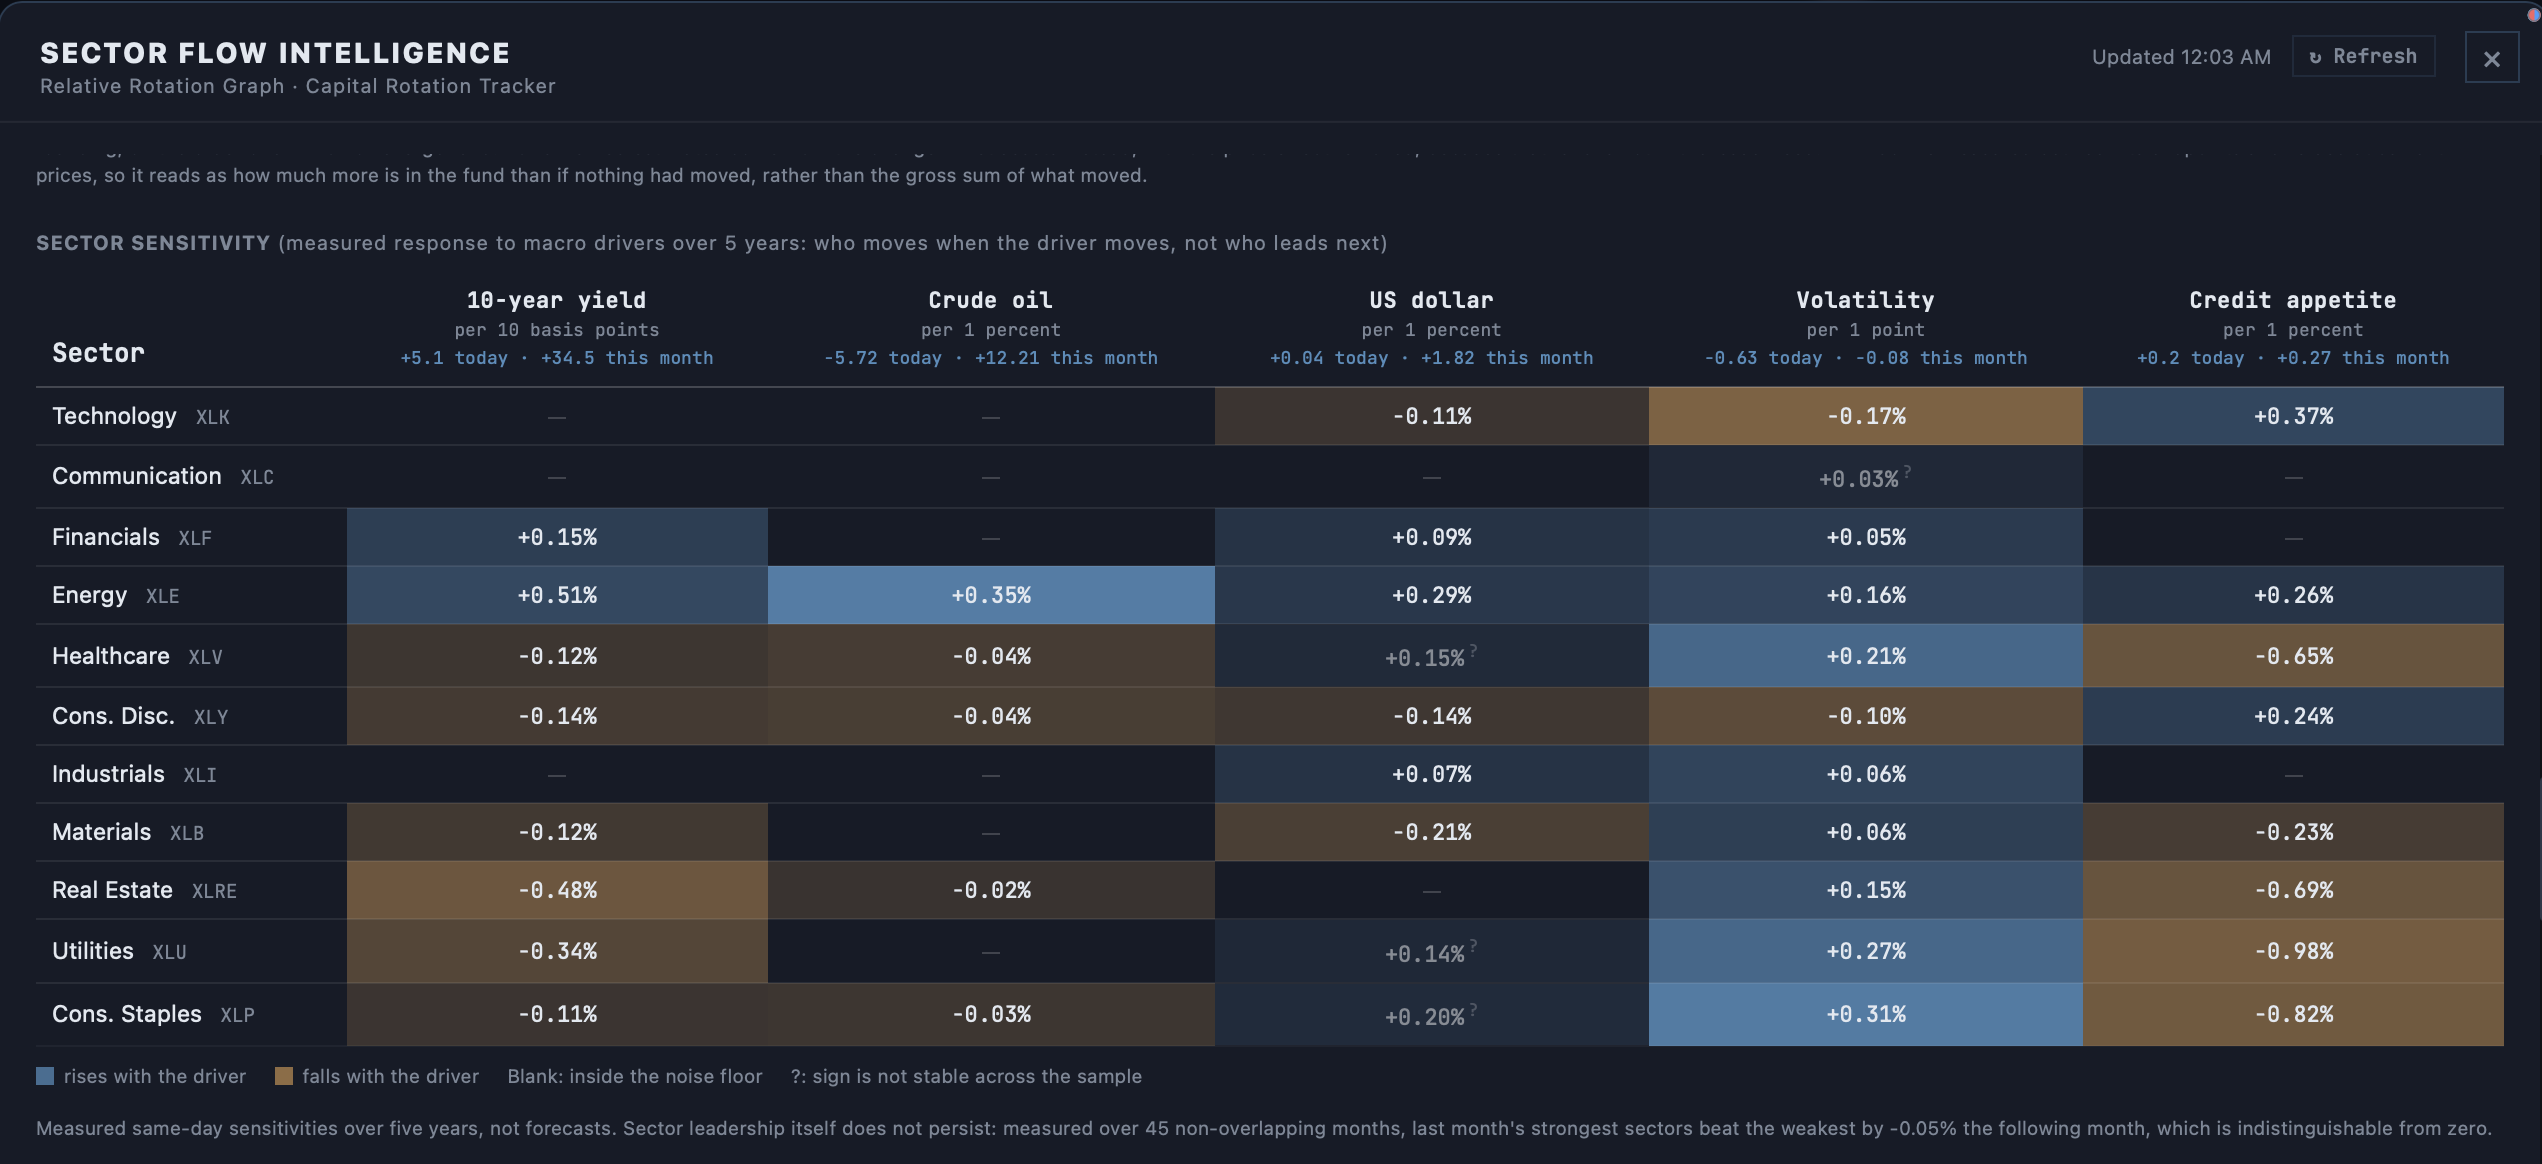
Sector Sensitivity
Which sectors actually move when a rate, a currency, or credit spreads move, measured in beta, not assumed.
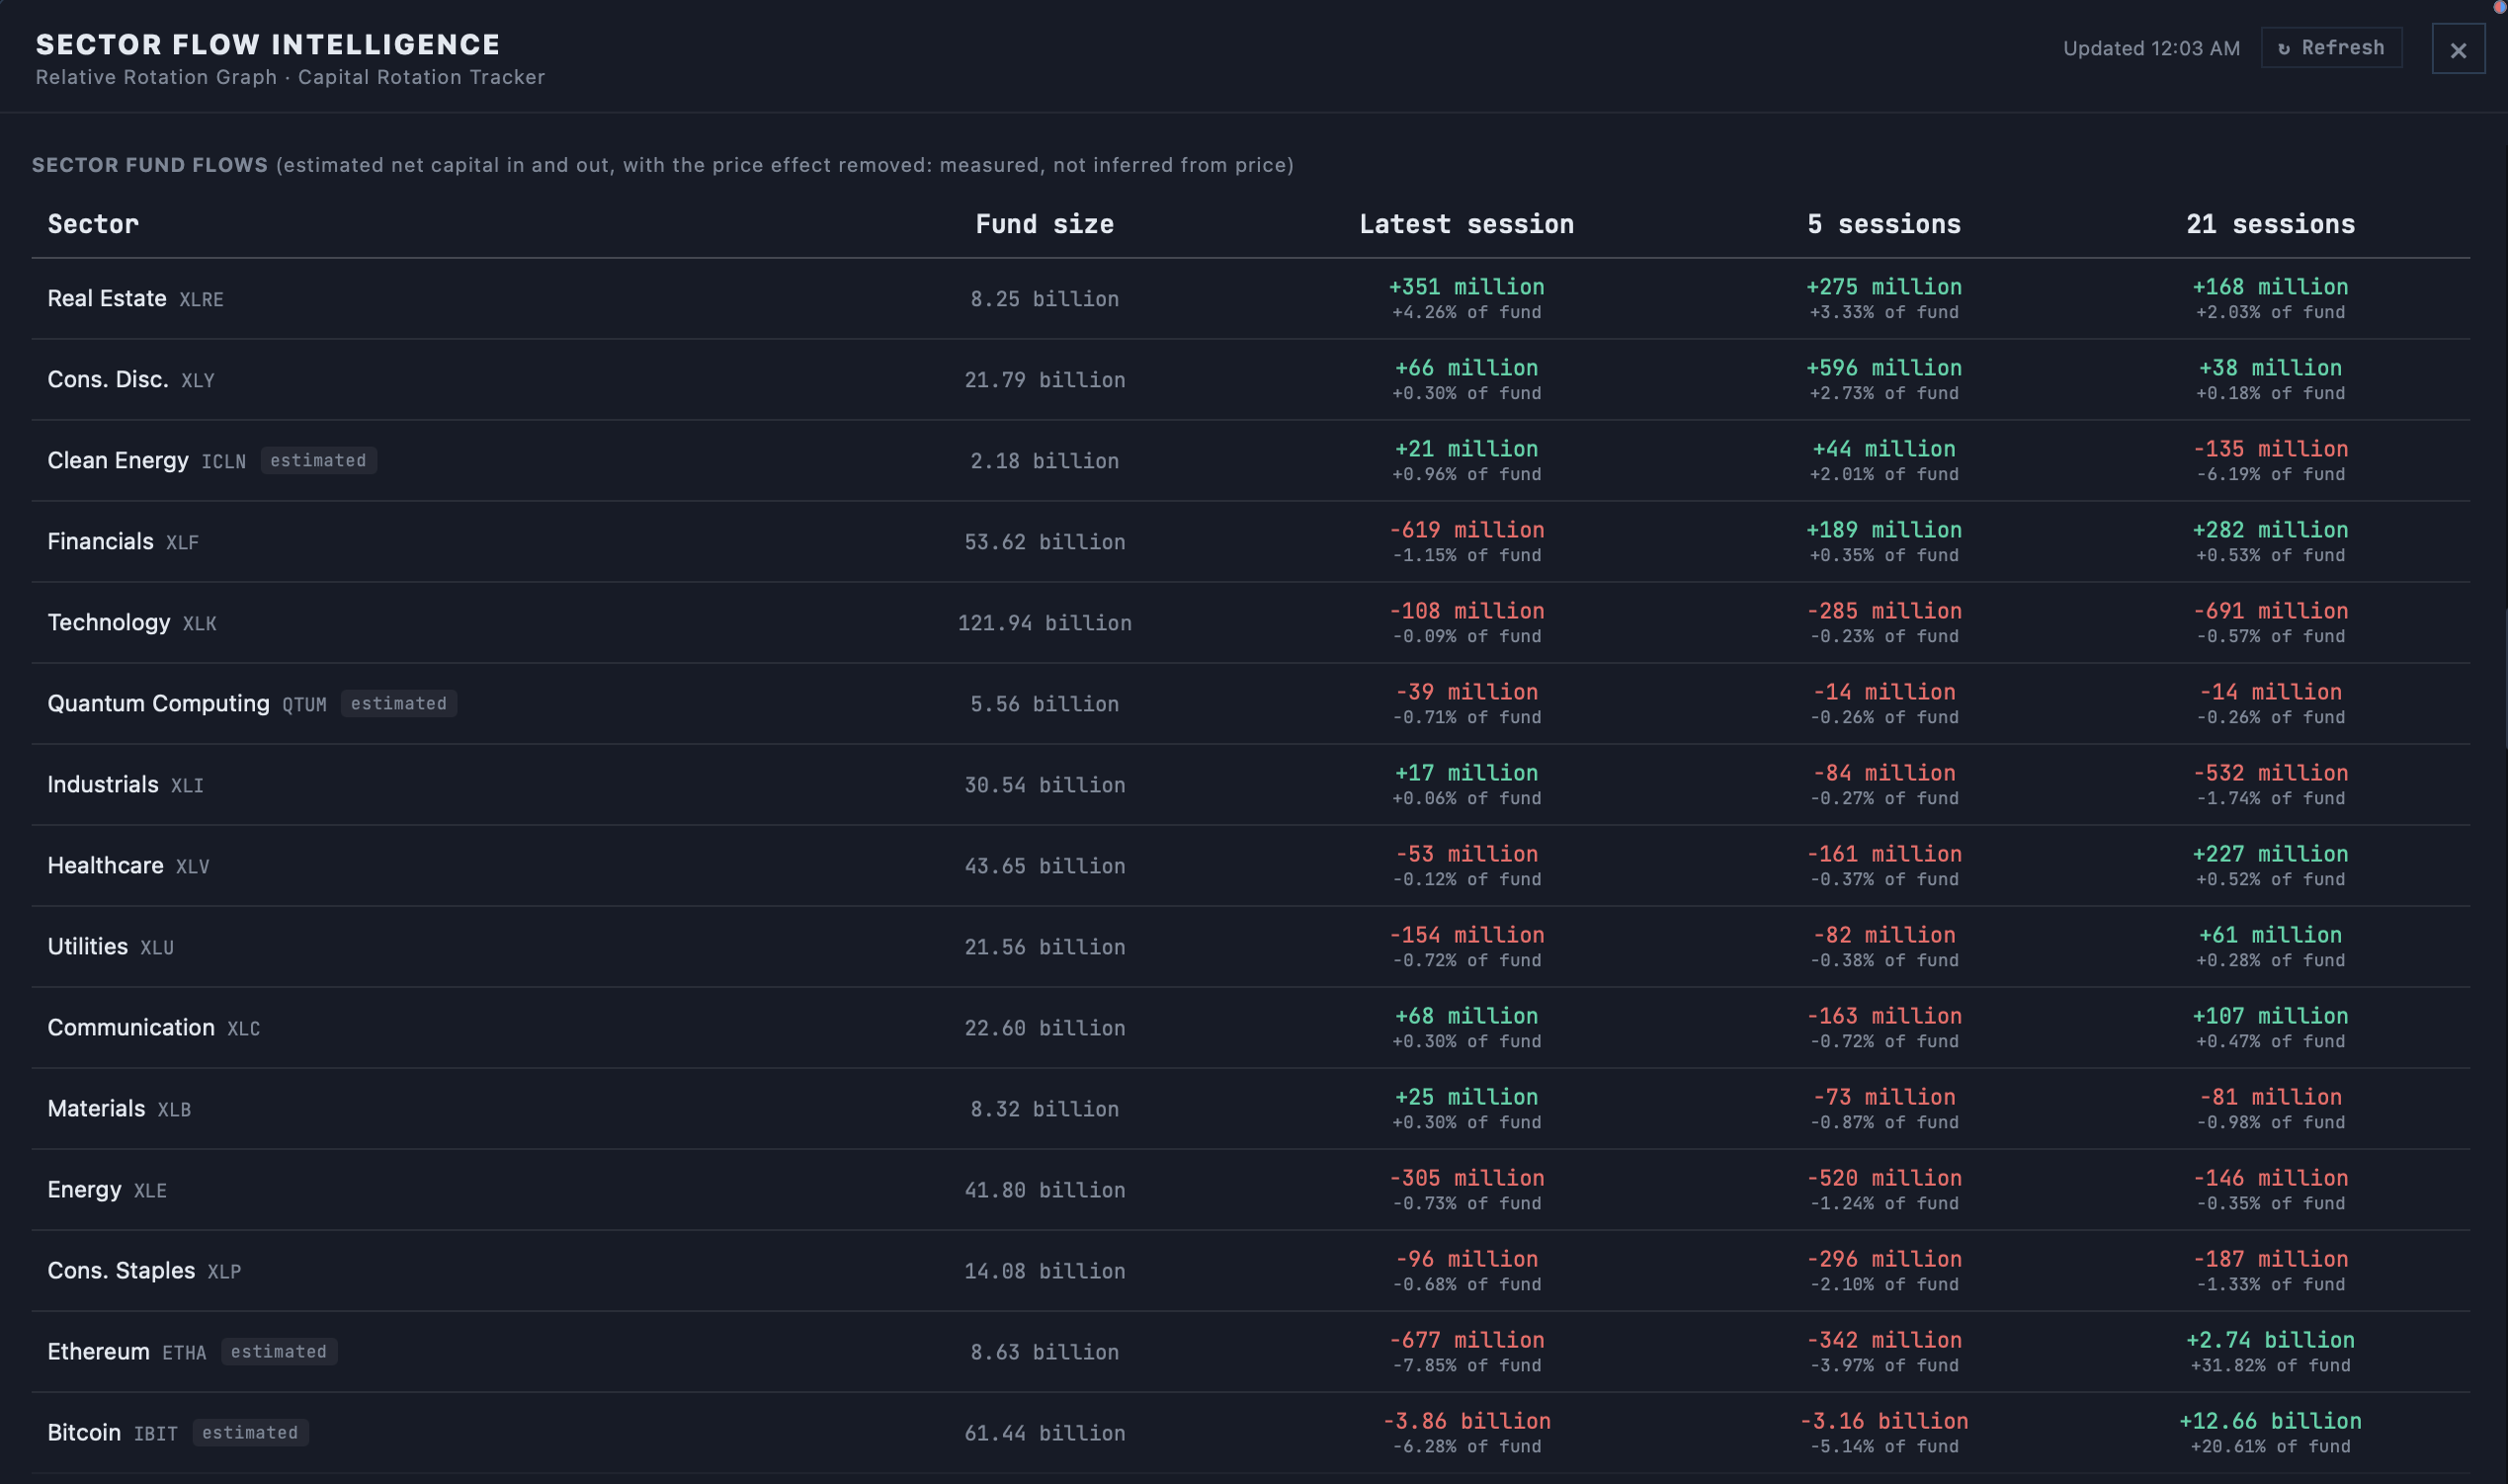
Sector Fund Flows
Estimated capital in and out of each sector fund, with the price effect removed, so a flow reads as money, not a rally.
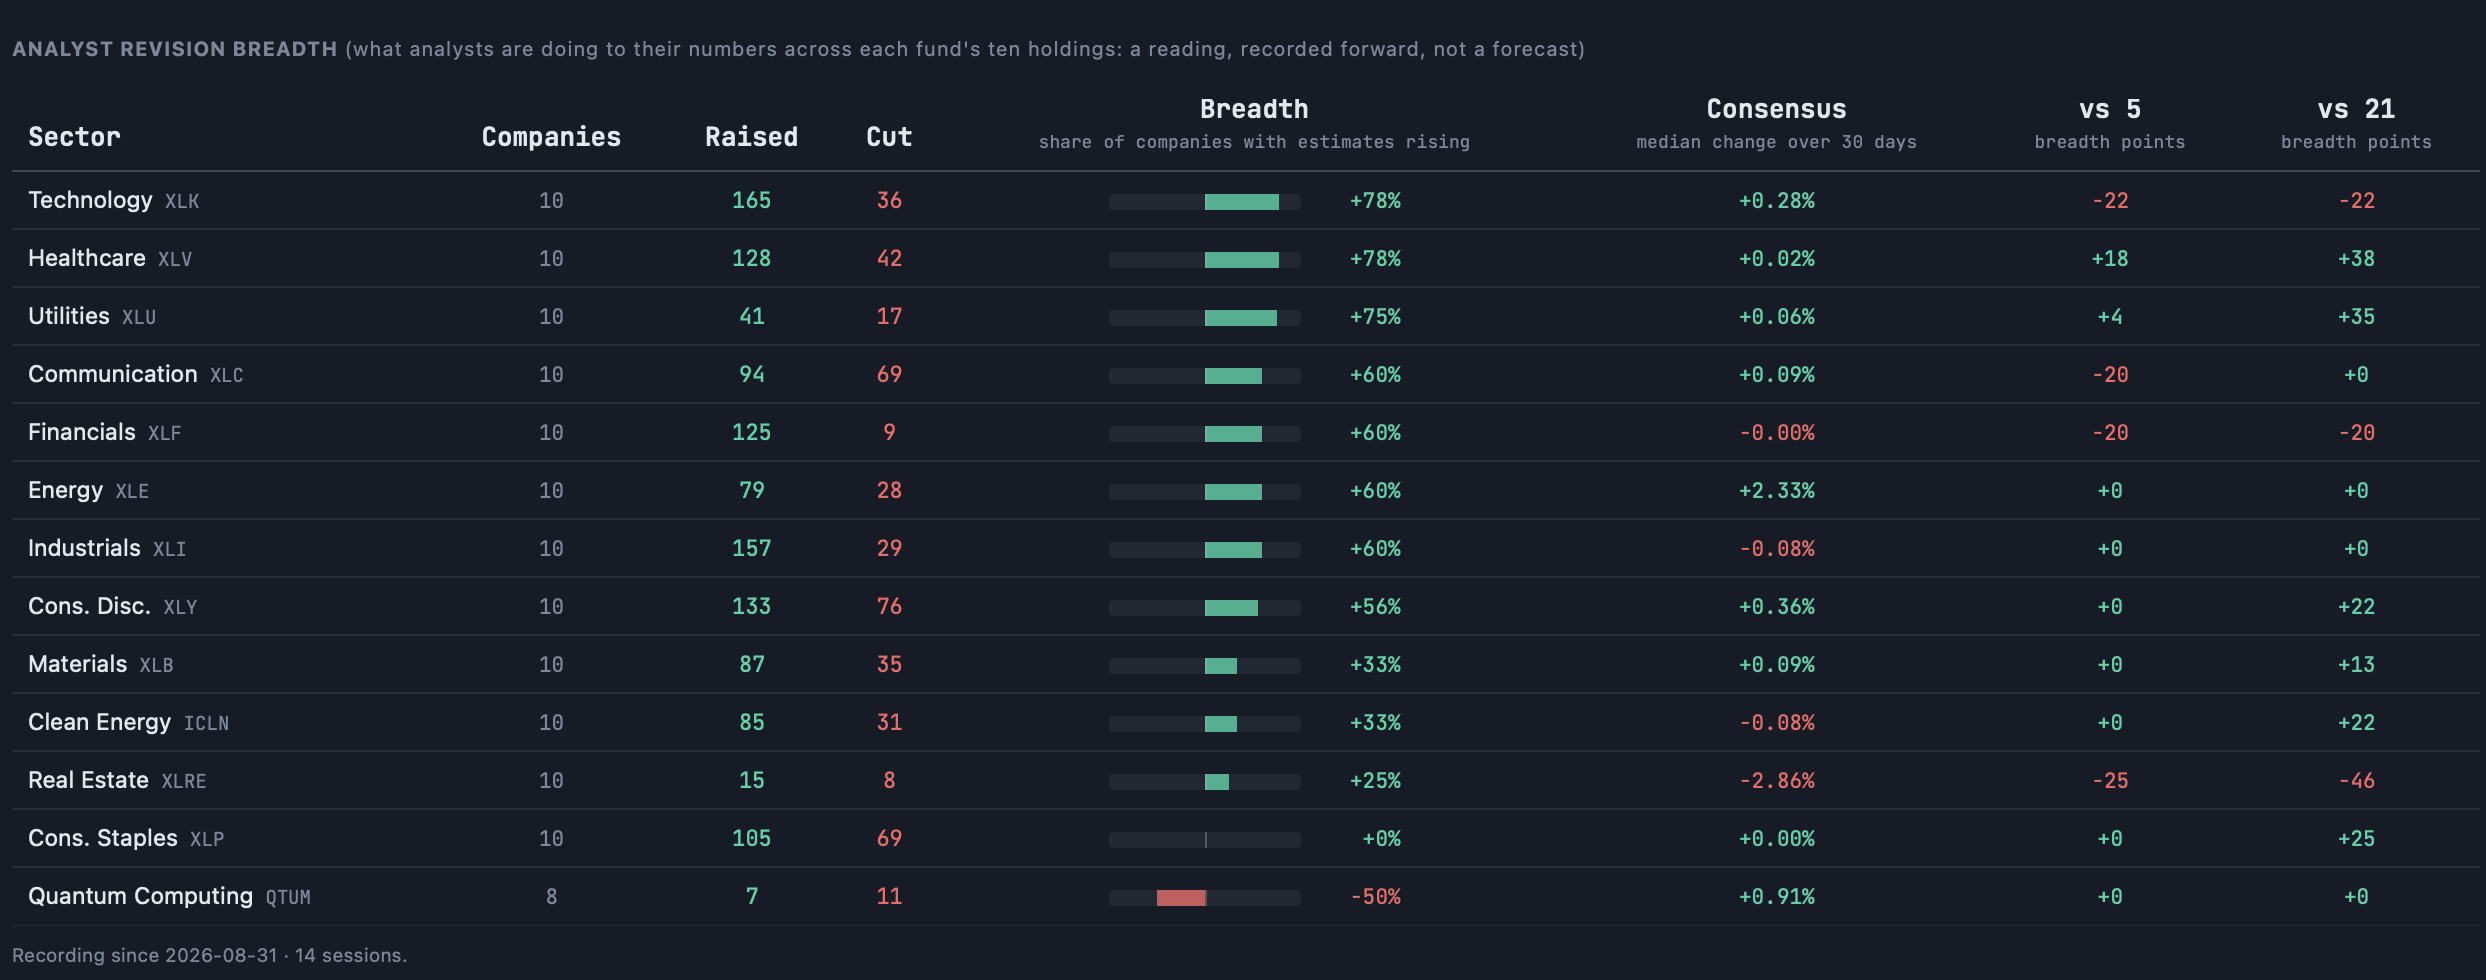
Revision Breadth
What analysts are doing to their numbers across a fund's holdings, recorded forward as it happens, never a forecast.
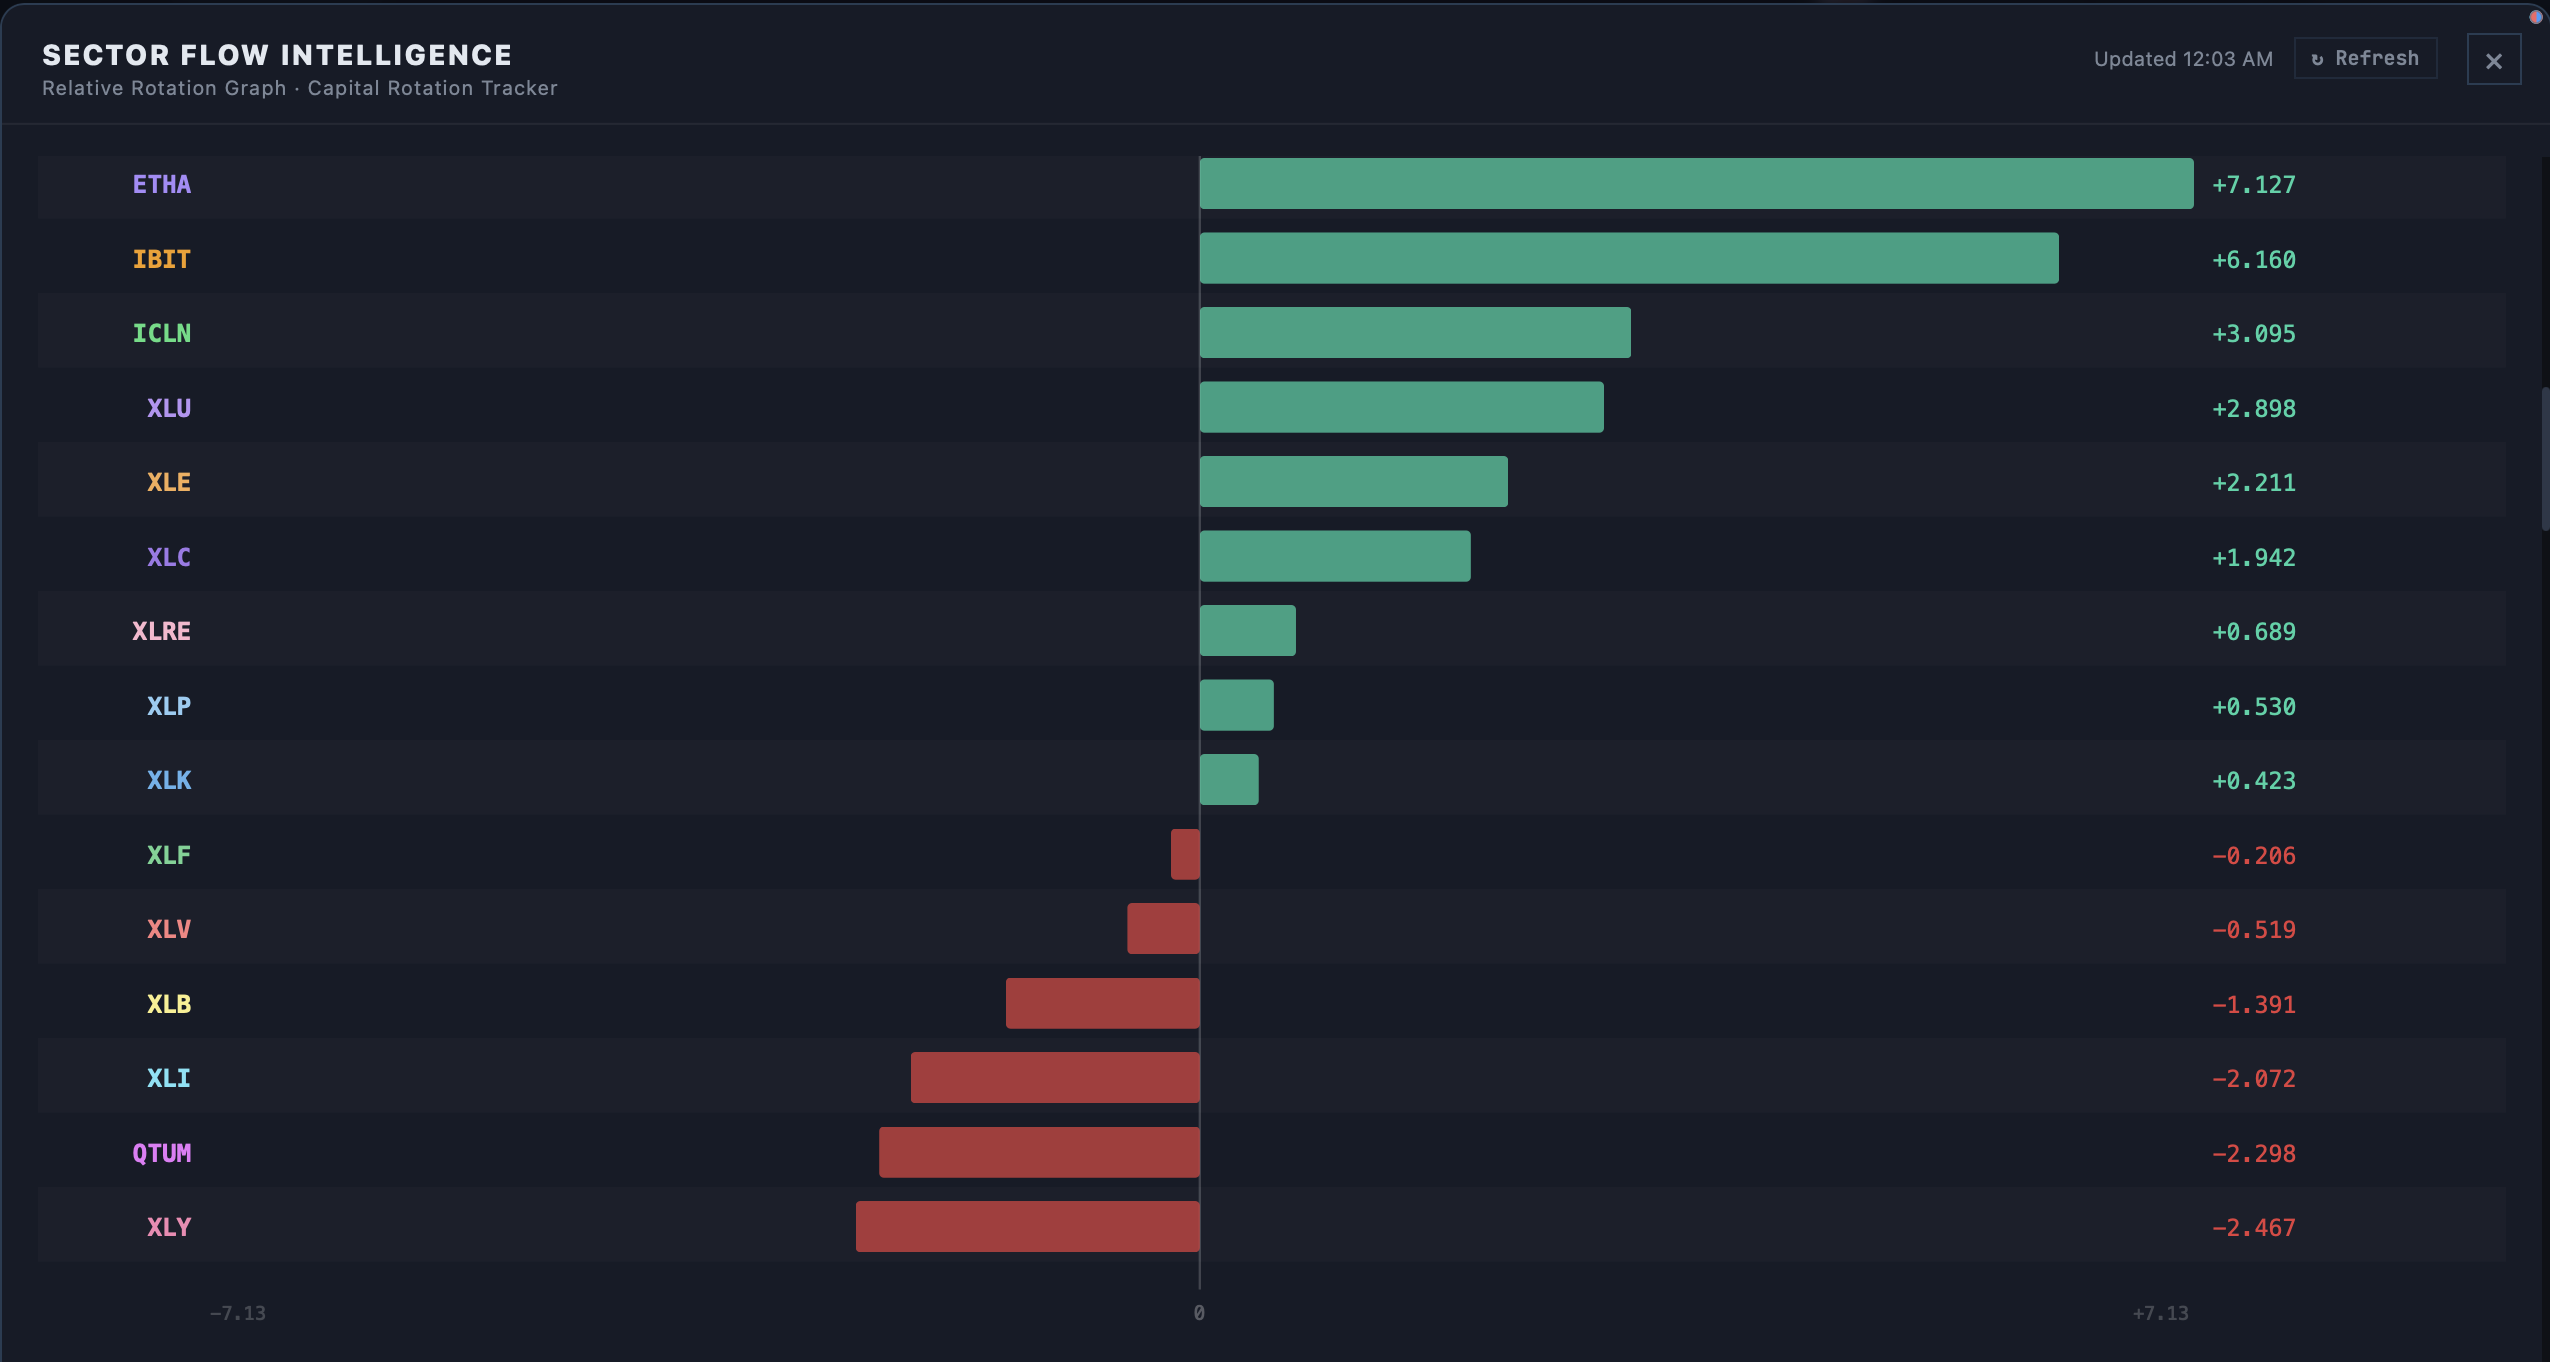
Sector Momentum
Every sector fund ranked by relative strength in one bar chart, greenest to reddest.